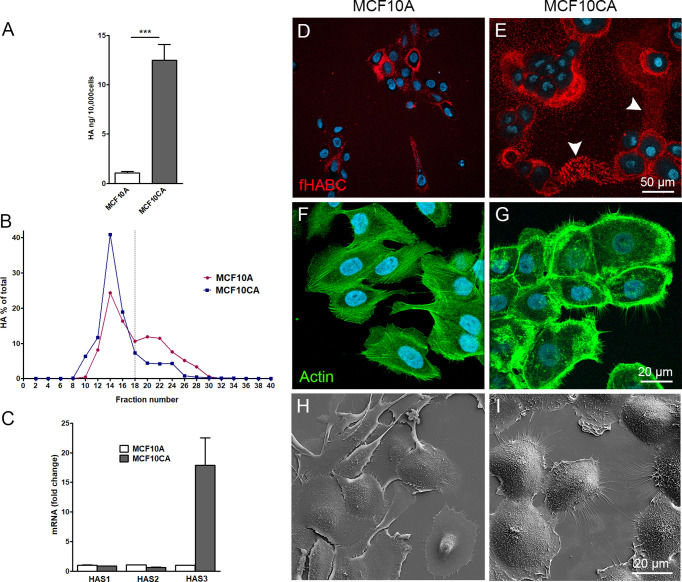
Figure 1.
MCF10CA cells synthesize more hyaluronan and express higher levels of HAS3 than MCF10A cells. Hyaluronan secretion levels by MCF10A and MCF10CA cell lines analyzed by hyaluronan assay (A) and analysis of relative molecular weight distribution of produced hyaluronan (B). Relative expression levels of HAS isoenzymes (C). Confocal images of live MCF10A (D) and MCF10CA (E) cells stained with fHABC to detect pericellular hyaluronan (arrowheads in E indicate HA-rich trails) and fixed cell stained with phalloidin to show actin cytoskeleton of MCF10A (F) and MCF10CA (G). Scanning electron microscopic images of MCF10A (H) and MCF10CA (I). Blue = nuclei in (D–G). The data represent means ± SE of 6 independent experiments in (A) ± SE of 3 independent experiments in (B, C) ***p < 0.001, Mann–Whitney test.

