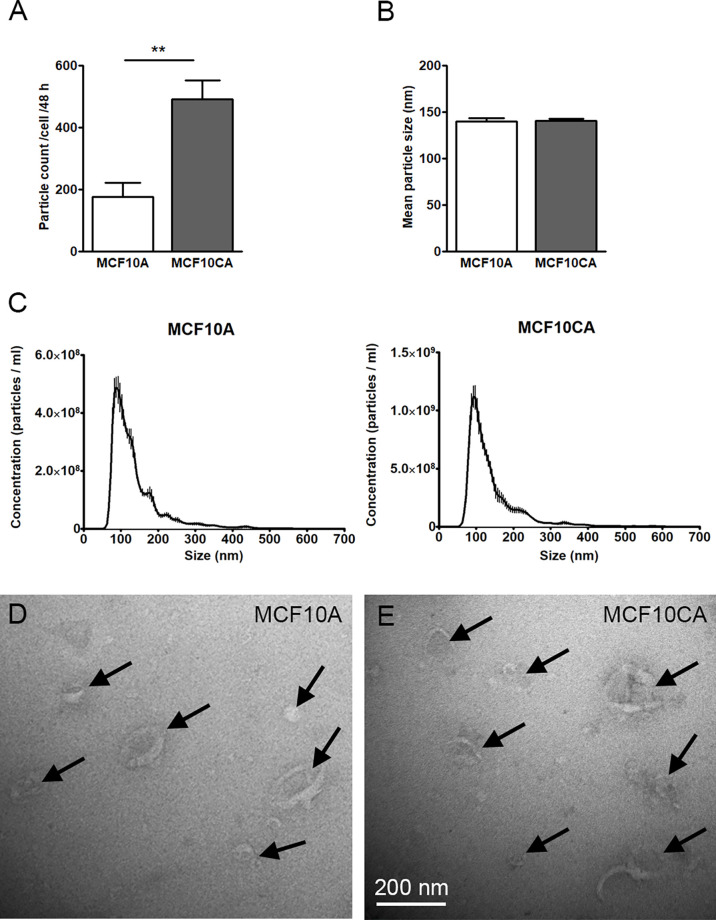
Figure 2.
MCF10CA cell produce more EVs than MCF10A cells. Particle counts (A), mean particle sizes (B) and size distributions (C) of EV isolates from MCF10 cell lines analyzed by NTA. TEM images from the same isolates are shown in (D, E). The data represent means ± SE of 5-6 independent experiments in (A, B) and means ± SE of 5-6 independent experiments in (C) **p < 0.01, Mann–Whitney test. Arrows point EVs in panels (D, E).

