Figure 5.

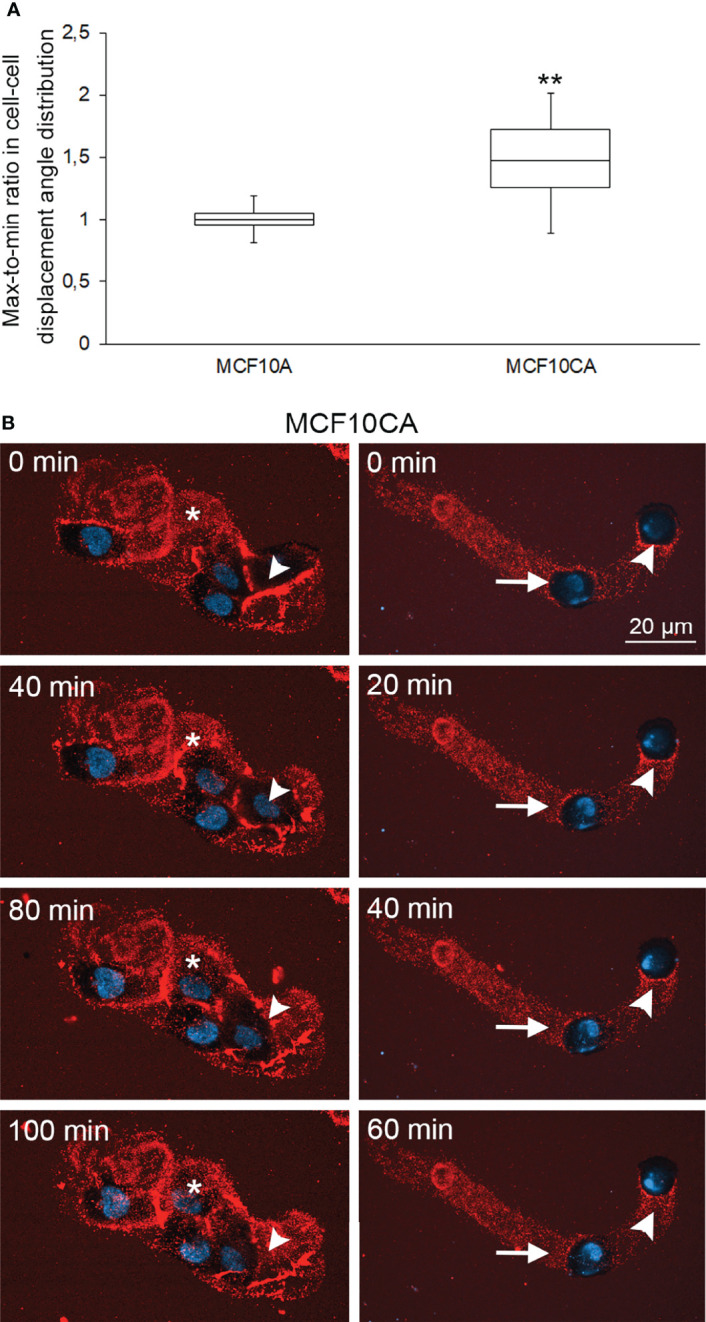
Collective cell motion is more coordinated in cancer cells than in normal cells. Whisker and box plot showing the distribution of correlation index (CI) for MCF10A (left) and MCF10CA (right) cells (A). Plots were constructed using data from 11 FOVs from 2 experiments for each cell type, totalizing several hundreds of cells. The CI of each FOV was normalized to the median CI of normal cells for the same experiment. **: Wilcoxon rank-text p-value p=0.0151. Two examples of collective migration of live MCF10CA cells along trails are shown in (B). Asterisks (*) indicate the hyaluronan-rich area that the migrating cell follows, and arrowheads show the trail that a moving cell leaves behind (left panel in B and Supplementary Movie 2). The right panel in B and Supplementary Movie 2 show an example of leader-follower behavior, where the original position (0 min) of the leader cell is indicated by an arrowhead and the follower cell by an arrow. Red = hyaluronan and blue = nuclei.
