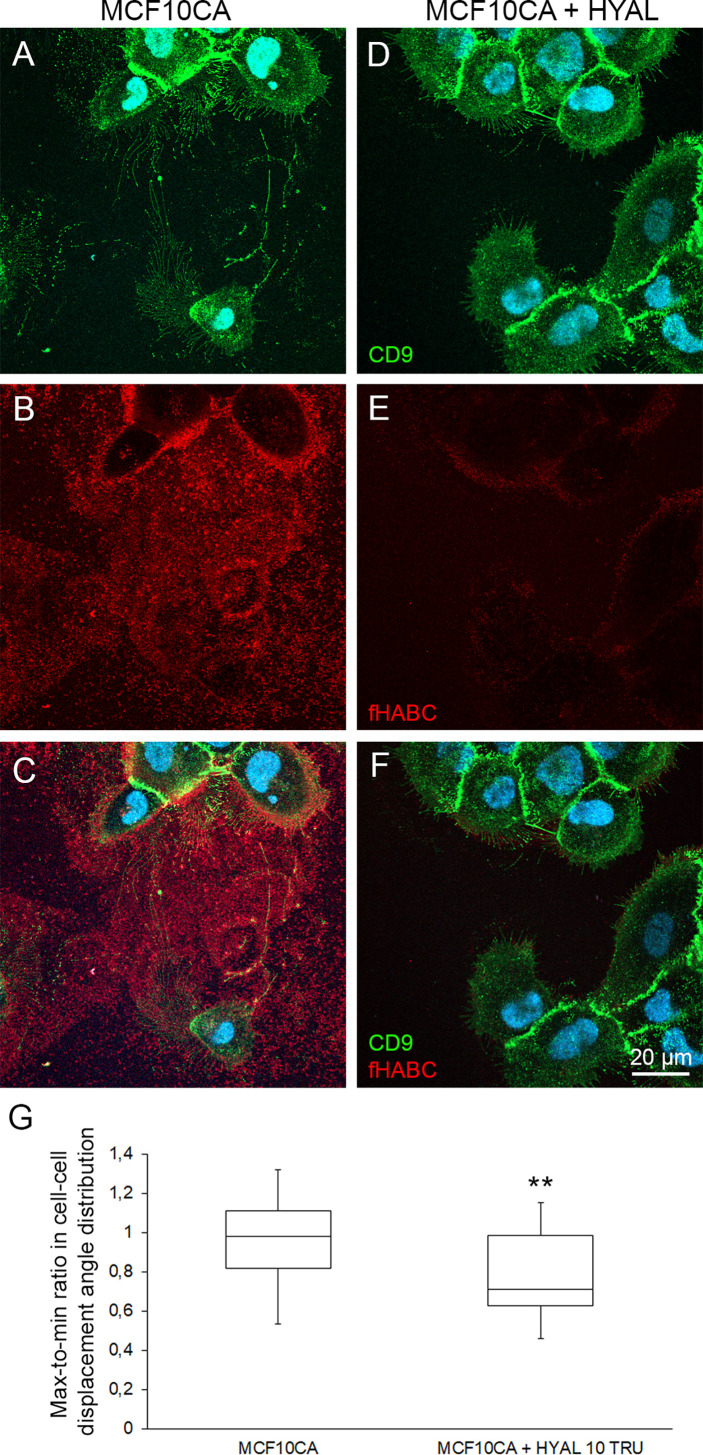
Figure 6.
Pericellular hyaluronan promotes the coordination of cell motion in cancer cells. Comparison of live MCF10CA control cells (A–C) and hyaluronidase-digested cells (D–F) stained with FITC-labeled CD9 and fHABC. Blue = nuclei. Whisker and box plot showing the distribution of correlation index (CI) for untreated (left) and hyaluronan-degrading enzyme-treated (right) cancer cells (G). Plots were constructed using data from 25 and 20 FOVs from 4 experiments for each condition respectively, totalizing several hundreds of cells. The CI for each FOV was normalized to the median CI of untreated cells for the same experiment. **: Wilcoxon rank-text p-value p=0.0068.

