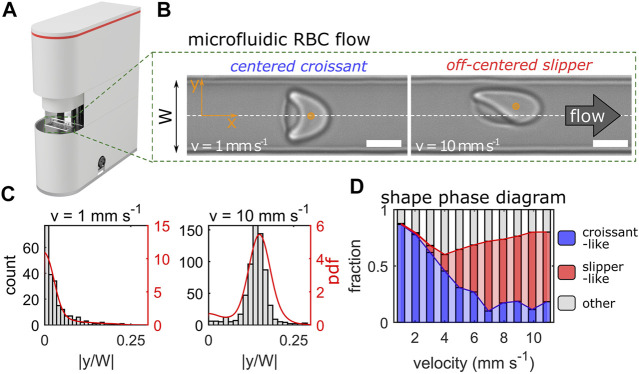
FIGURE 1.
Erysense® device and principle of measurement. (A) Image of the Erysense® device. (B) Representative images of a croissant-shaped and a slipper-shaped RBC at low (1 mm/s) and high (10 mm/s) velocity, respectively. Scale bars represent 5 µm. Flow is from left to right and the dashed white line indicates the channel centerline in the y-direction with a channel width W. (C) Representative histograms and probability density functions (pdf) of the normalized cell’s center-of-mass in y-direction at a low (1 mm/s) and high (10 mm/s) velocity. (D) Representative shape phase diagram of a healthy control showing croissant-like, slipper-like, and other RBC shapes as a function of the cell velocity.

