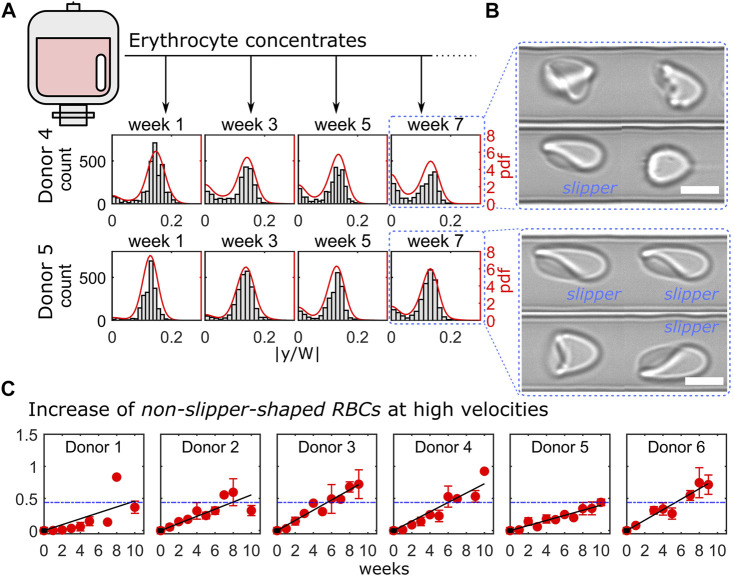
FIGURE 4.
Cell shape characterization within 10 weeks of erythrocyte concentrate storage. (A) Representative histograms and probability density functions (pdfs) of the RBC y-positions for donor 4 (top) and donor 5 (bottom) at a velocity of 10 mm/s for four consecutive weeks. (B) Representative RBC shapes for both donors at week 7. Scale bars represent 5 µm. (C) Ratio between centered cell shapes and slipper-shaped RBCs for all donors as a function of time. Red symbols correspond to measurements’ average over a velocity range of 8–10 mm/s and black lines represent linear fits. Blue dashed horizontal lines indicate the mean value of the linear fits for all donors at week 6. The analysis presented was performed on in average 4847 cells per donor and time point (between 2213 and 9958 cells).

