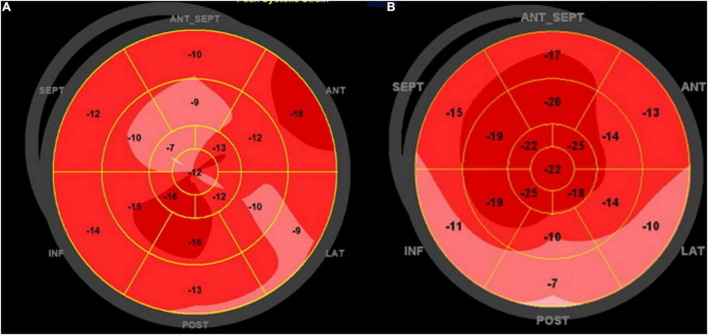
FIGURE 2.
Global longitudinal strain polar map from 17 segments: (A) patient with NACR and (B) patient with PACR. Numbers inside each segment represent segmental strains color-coded in shades of red, and lower values are lighter shades. The strain was reduced in PACR and NACR with an irregular patch pattern as observed in the (A,B).

