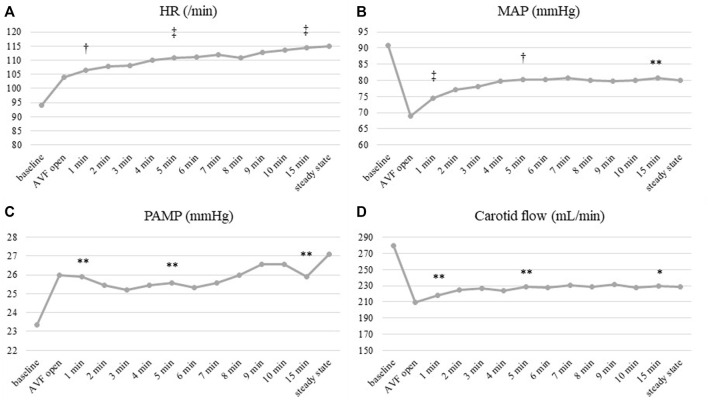
FIGURE 4.
Time course of hemodynamic parameters after AVF opening. (A) Heart rate, (B) Mean arterial pressure (MAP), (C) Pulmonary artery mean pressure (PAMP), (D) Carotid artery flow. HR and PAMP (A,C) increased immediately after AVF opening and showed a continuous increase afterwards. MAP and carotid artery flow (B,D) dropped rapidly, then rose after the initial dip; the resulting values remained lower than in baseline. Significance of observed changes after AVF opening vs. baselines was calculated at 1, 5 and 15 min after AVF opening. Displayed values are averaged from all subjects. *p < 0.05; **p < 0.01; †p < 0.001; ‡p < 0.0001.

