FIGURE 5.

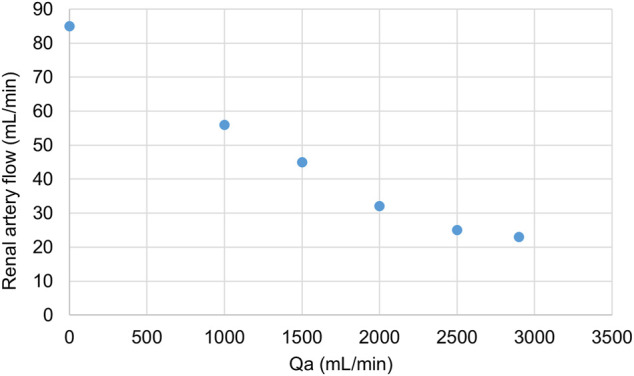
Changes in renal artery flow with increasing Qa. Displayed values were obtained from one subject. Qa was regulated by a clamp on the ECMO set.

Changes in renal artery flow with increasing Qa. Displayed values were obtained from one subject. Qa was regulated by a clamp on the ECMO set.