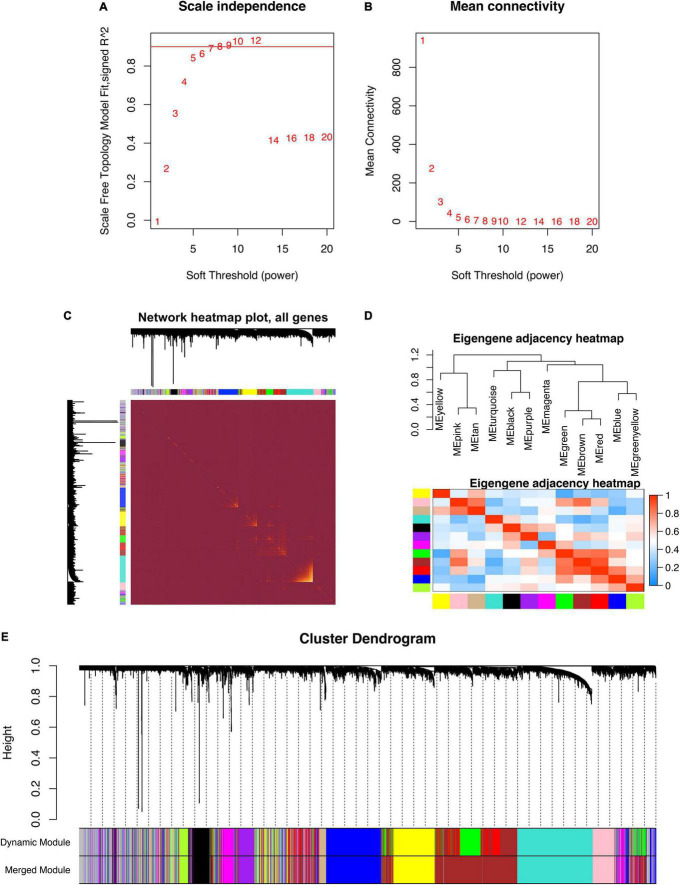
FIGURE 2.
The construction of weighted gene co-expression network. (A) Scale-free topological indices at various soft-thresholding powers. (B) The correlation analysis between the soft-thresholding powers and mean connectivity of the network. (C) The heatmap of the topological overlap matrix of genes selected by WGCNA. (D) The heatmap of the eigengene adjacency. (E) Gene clustering diagram based on hierarchical clustering under optimal soft-thresholding power.

