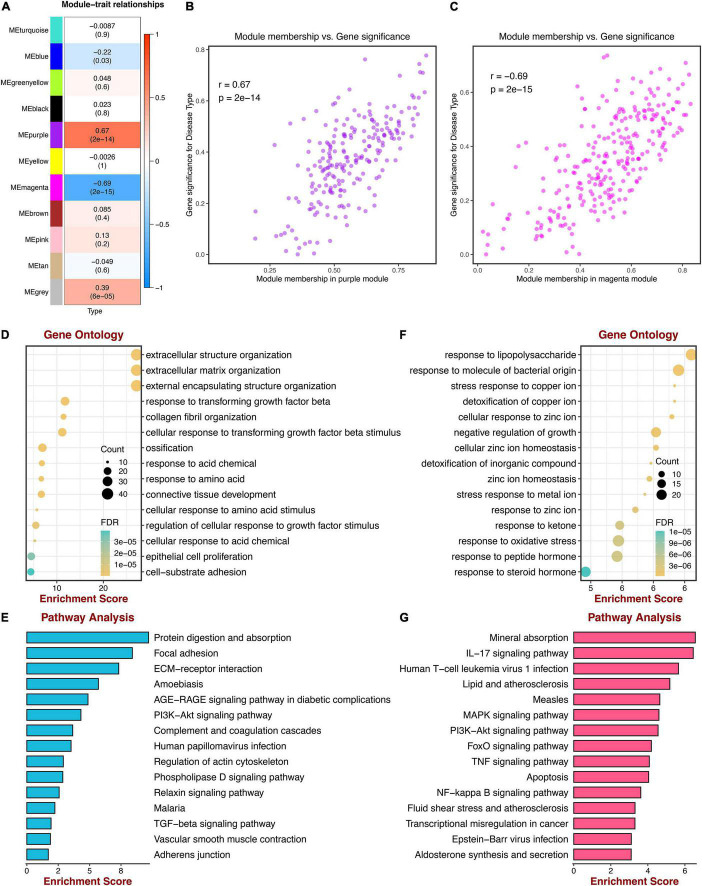
FIGURE 3.
Correlations between gene modules and DCM; GO, and KEGG enrichment analysis. (A) Correlations between gene modules and DCM status. (B) The correlation between the purple module memberships and the gene significance for DCM. (C) The correlation between the magenta module memberships and the gene significance for DCM. (D) Go enrichment analysis of genes in the purple module. (E) KEGG pathway analysis of genes in the purple module. (F) GO enrichment analysis of genes in the magenta module. (G) KEGG pathway analysis of genes in the magenta module.

