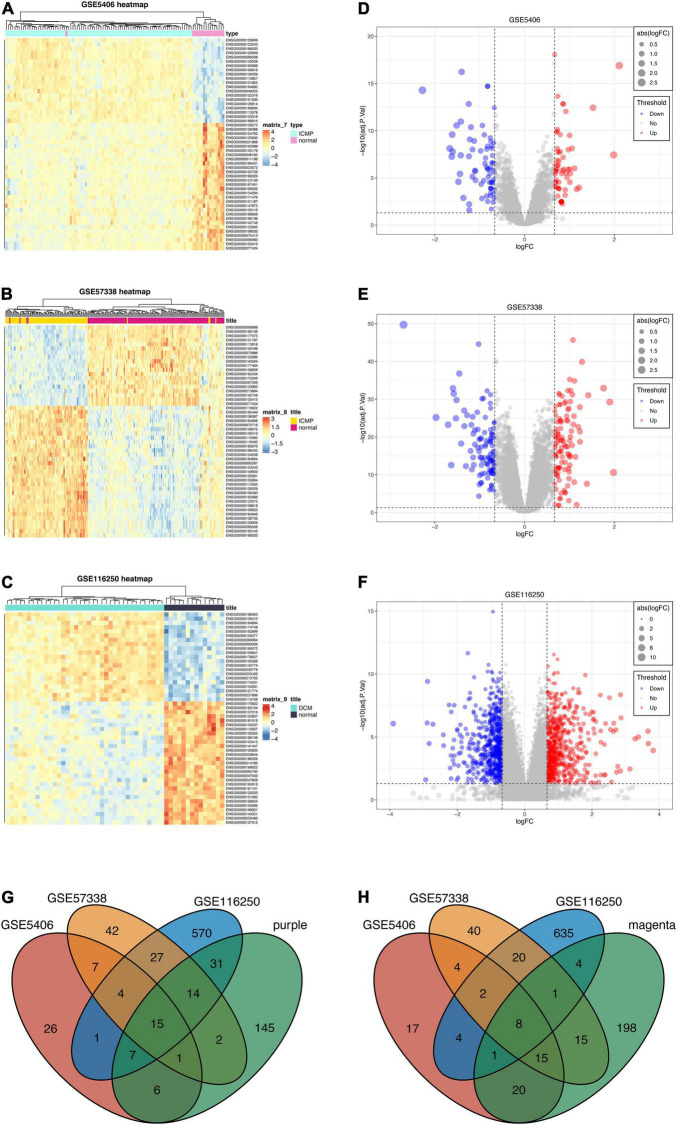
FIGURE 5.
Differential expression analysis of three datasets and intersections for key genes. (A–C) Heatmaps of DEGs in three datasets (GSE5406, GSE57338, GSE116250). (D–F) Volcano plots of DEGs in three datasets (GSE5406, GSE57338, GSE116250). (G) The intersection between the up-regulated genes of three datasets and genes of the purple module. (H) The intersection between the down-regulated genes of three datasets and genes of the magenta module.

