. 2018 Dec 10;8(72):41192–41206. doi: 10.1039/c8ra09506j

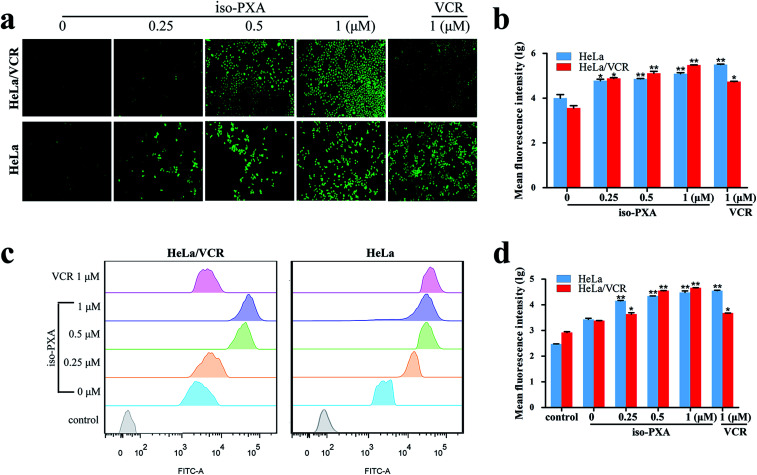
Fig. 5. iso-PXA induced ROS production and mitochondrial dysfunction. (a) ROS production was detected by fluorescence microscopy after HeLa/VCR and HeLa cells were treated with iso-PXA (0, 0.25, 0.5 and 1 μM) and VCR (1 μM) for 24 h. (b) The statistical fluorescence data of the ROS production. (c) iso-PXA induced loss of mitochondrial membrane potential in HeLa/VCR and HeLa cells. Cells were treated with gradient concentrations of iso-PXA for 24 h, and the mitochondrial membrane potential was analyzed by flow cytometry after cells were stained with JC-1. (d) The statistical fluorescence data of the mitochondrial dysfunction. Columns represent the means ± SD values obtained from three individual experiments. *P < 0.05, **P < 0.01 HeLa/VCR vs. HeLa control.

Fig. 5