. 2018 Dec 6;8(71):40894–40911. doi: 10.1039/c8ra07163b

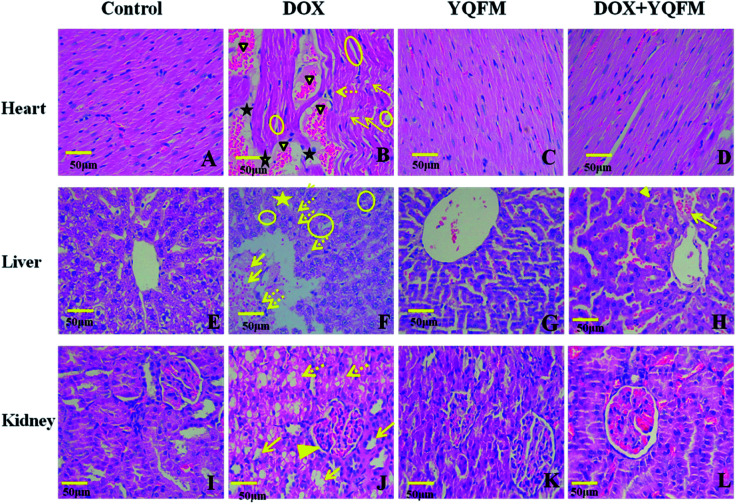
Fig. 12. Micrograph of haematoxylin and eosin stained sections of heart, liver and kidney tissue depicting (400×). (A) Normal saline (0.4 mL kg−1, i.p.) control group (n = 10) of heart tissue, (B) DOX control group (DOX, n = 10) of heart tissue, showing DOX-induced myofibrillar loss (arrows), inflammatory cell infiltration (dotted arrows), cytoplasmic vacuolization (circles), edema (star), and congestion (solid triangle). (C) YQFM (0.481 g kg−1, i.p. n = 10) group of heart tissue, (D) YQFM (0.481 g kg−1, i.p.) treated DOX group (n = 10) of heart tissue. (E) Normal saline (0.4 mL kg−1, i.p) control group (n = 10) of liver tissue, showing normal polyhedral hepatic cells and clear hepatic cords, (F) DOX control group (DOX, n = 10) of liver tissue, indicating DOX-caused severe congestion of portal blood vessels (arrows), necrosis of hepatocytes (star), hepatic cell which showed obscure and fiberized boundary and inflammatory cell infiltration (dotted arrows), and also showing diffuse vacuolar degeneration and nuclear pyknosis (circles). (G) YQFM (0.481 g kg−1, i.p. n = 10) group of liver tissue, showing the same structure as normal saline control group. (H) YQFM (0.481 g kg−1, i.p.) treated DOX group (n = 10) of liver tissue, showing some diffuse vacuolar degeneration and nuclear pyknosis (solid triangle) and mild portal vein congestion (arrow). (I) Normal saline (0.4 mL kg−1, i.p.) control group (n = 10) of kidney tissue, (J) DOX control group (DOX, n = 10) of kidney tissue, displaying significant oedema and vacuolation, hydropic degeneration (arrows) and necrosis atrophy (dotted arrows) in epithelial cells of the proximal and distal tubules, and also showing glomerular atrophy (solid triangle). (K) YQFM (0.481 g kg−1, i.p. n = 10) group of kidney tissue, (L) YQFM (0.481 g kg−1, i.p.) treated DOX group (n = 10) of kidney tissue. Bar = 50 μm.

Fig. 12