. 2018 Dec 6;8(71):40894–40911. doi: 10.1039/c8ra07163b

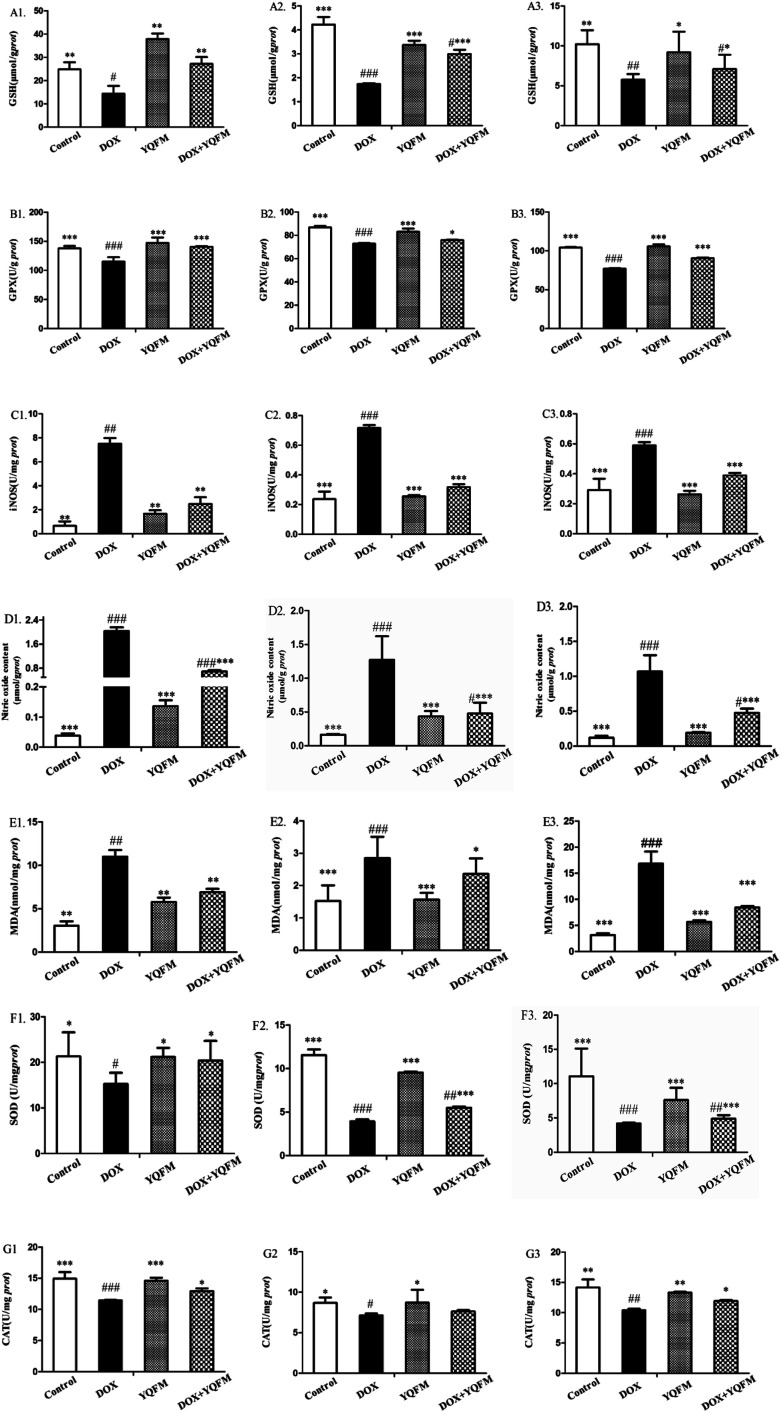
Fig. 9. Effects of YQFM on DOX-induced changes were analyzed in oxidative stress markers and antioxidant enzyme activities in different tissues. (A1) GSH in heart, (A2) GSH in liver, (A3) GSH in kidney, (B1) GPx in heart, (B2) GPx in liver, (B3) GPx in kidney, (C1) iNOS in heart, (C2) iNOS in liver, (C3) iNOS in kidney, (D1) NO in heart, (D2) NO in liver, (D3) NO in kidney, (E1) MDA in heart, (E2) MDA in liver, (E3) MDA in kidney, (F1) SOD in heart, (F2) SOD in liver, (F3) SOD in kidney, (G1) CAT in heart, (G2) CAT in liver, (G3) CAT in kidney. The level of those markers in the heart tissue of control group, DOX group, YQFM group and YQFM treated DOX group. The results were showed as the mean ± SEM (n = 10) *p < 0.05, **p < 0.01, ***p < 0.001 vs. DOX group; #p < 0.05, ##p < 0.01, ###p < 0.001 vs. control group.

Fig. 9