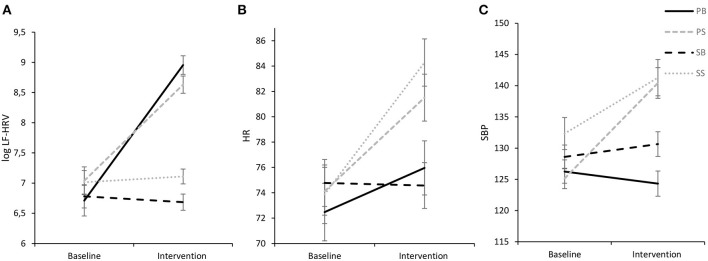
Figure 3.
Experimental intervention effects for log LF-HRV (A), HR (B), and SBP (C) (M ± 1 SE). log LF-HRV, low-frequency HRV; HR, heart rate; SBP, systolic blood pressure; ln, natural logarithmic transformation. PB, paced breathing at 0.1 Hz; PS, paced singing at 0.1 Hz; SB, spontaneous breathing; SS, spontaneous singing. This figure show elevated LF-HRV for both paced interventions and increases in cardiovascular activity for both singing interventions.

