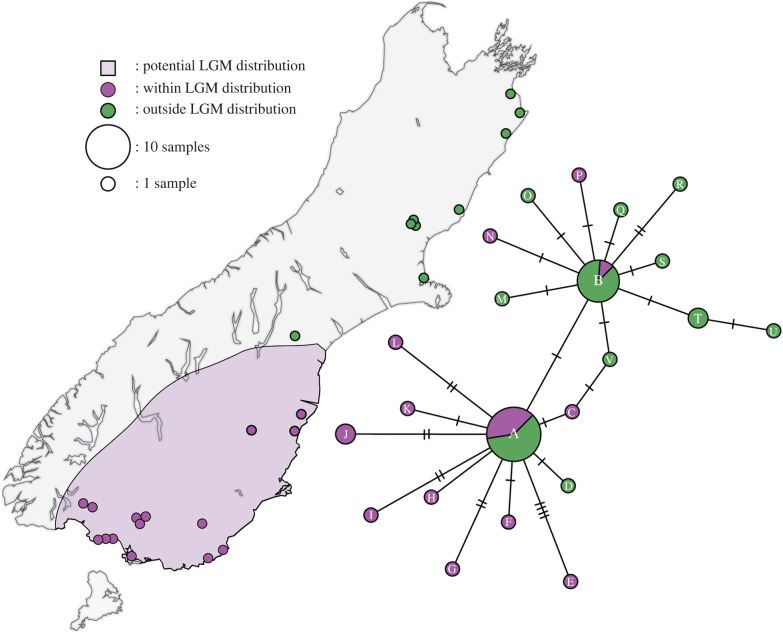
Figure 2.
Map of the South Island of New Zealand illustrating samples and sites that fall inside (purple) and outside (green) of the putative refugial area occupied by eastern moa during the Last Glacial Maximum (purple shading). The accompanying network illustrates the relationships between eastern moa mitochondrial haplotypes. Circle size is proportional to haplotype frequency, while mutations are represented by hatch marks. Haplotypes are labelled (A–V), please see electronic supplementary material, table S2 for the haplotype assigned to each sample.

