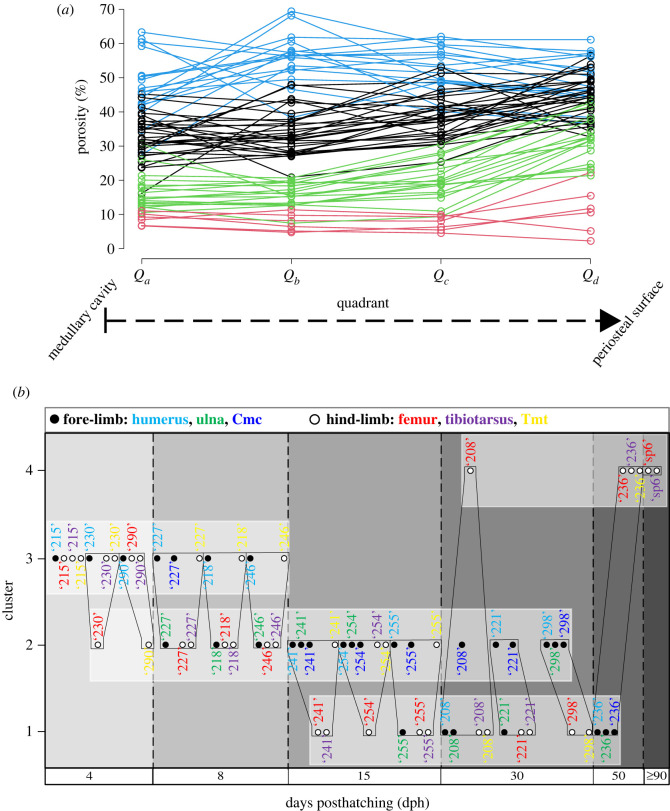
Figure 5.
4-group K-means clustering of the duck RPP dataset—excluding two hind-limb elements with missing data points—demonstrated by different graphical representations. (a) Raw RPPs with their cluster memberships indicated by the four different colours. (b) Cluster compositions with each element identifiable within their respective groups. Elements are sorted along the horizontal axis by the age of the ducks. Black polygons connect bones belonging to the same individual. Note how cluster memberships within cohorts reflect the characteristics of skeletal dissociation (i.e. assignment of an individual's bones into different clusters) as ontogeny progresses, showing a trend of separation of certain wing and leg elements. Colours indicate homologous elements as shown in the legend. Element IDs as given in the electronic supplementary material, table S1.

