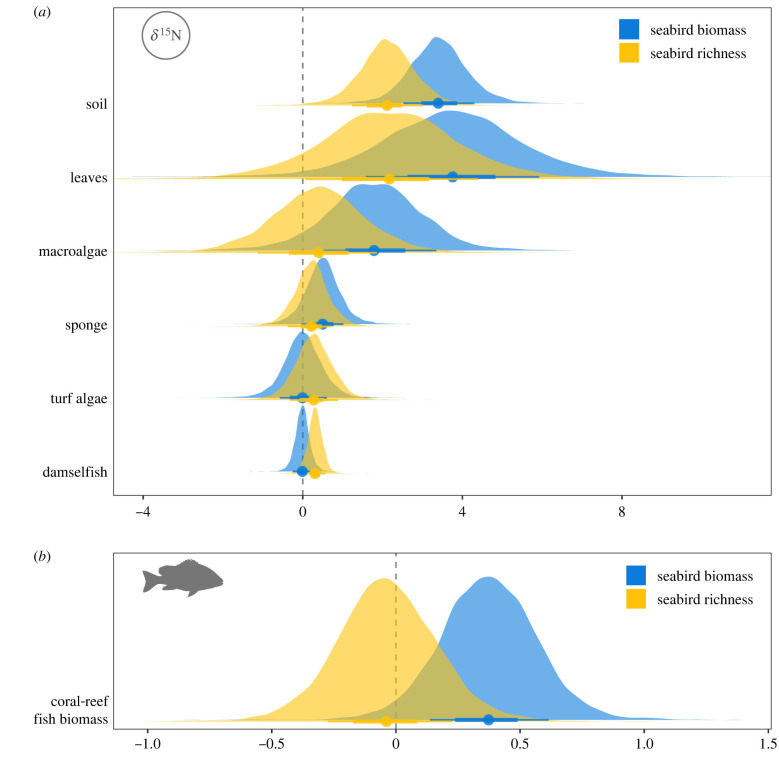
Figure 1.
Posterior distributions for the standardized effects of seabird biomass (log[kg ha−1]) and diversity (species richness) on (a) δ15N values of soil, leaves, macroalgae, sponge, turf algae and damselfish and (b) total coral-reef fish biomass (log[kg ha−1]). Points indicate median estimates and bars represent 50 and 80% highest posterior density intervals (HPDIs). (Online version in colour.)

