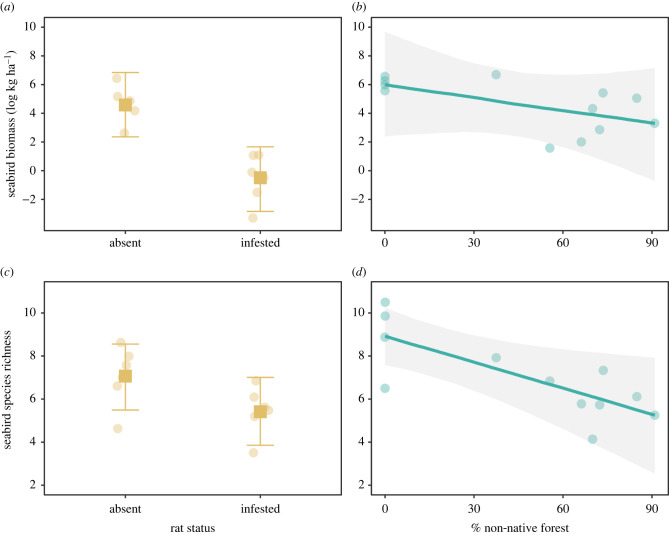
Figure 2.
Conditional effects of introduced rats and non-native vegetation on (a,b) seabird biomass (log[kg ha−1]) and (c,d) diversity (species richness). (a,c) Circles represent partialized residuals, squares represent median estimates and error bars represent 75% confidence intervals from multilevel Bayesian models. (b,d) Points represent partialized residuals, lines represent predicted fits and shading represents 75% confidence intervals from multilevel Bayesian models. (Online version in colour.)

