Figure 2.

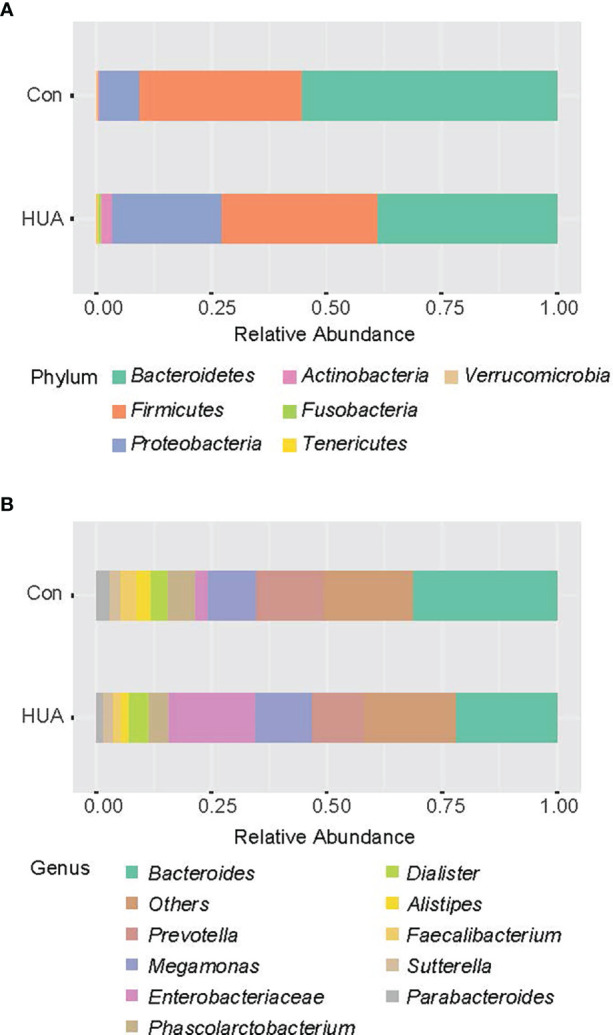
Bar chart representing Mann–Whitney U-test results on OTUs grouped in phyla (A) and in genus (B) of the HUA and Con subjects (showing top 10 taxa). HUA, hyperuricemia; Con, control.

Bar chart representing Mann–Whitney U-test results on OTUs grouped in phyla (A) and in genus (B) of the HUA and Con subjects (showing top 10 taxa). HUA, hyperuricemia; Con, control.