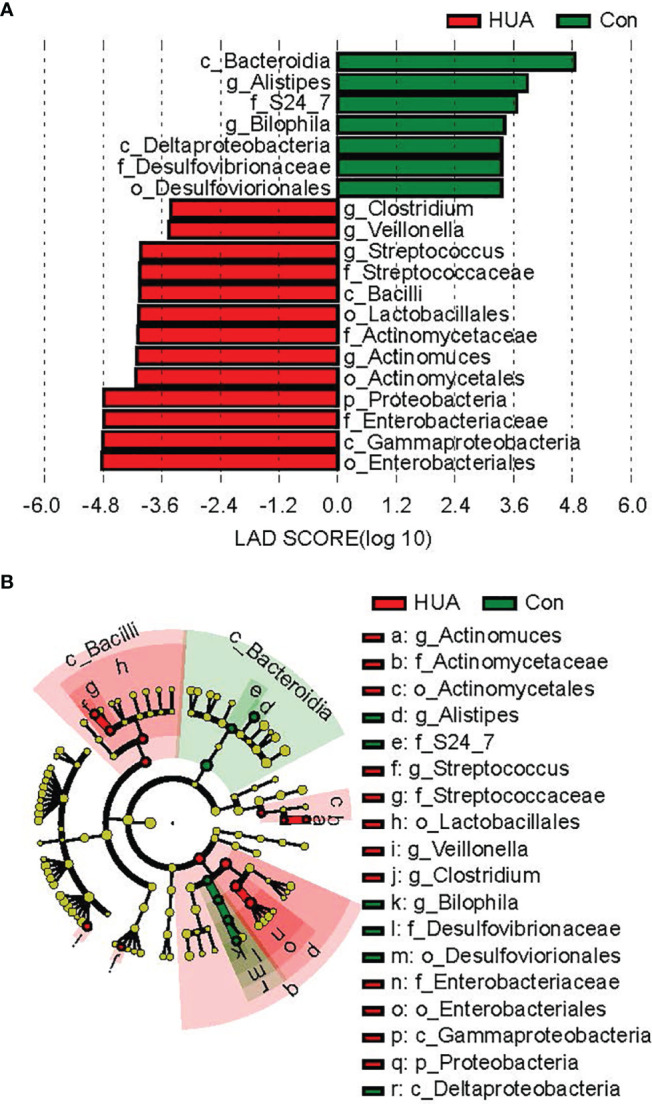
Figure 4.

Differential biomarkers in HUA and Con subjects by LefSe analysis (α value = 0.05, logarithmic LDA score threshold = 2.0). HUA, hyperuricemia; Con, control. In the LEFse tree, different colors indicate different groups. Note colored in a group color shows an important microbe biomarker in the group and the biomark name will list in the upper right corner. The yellow notes represent the biomarker which do not show any importance in groups. (A) LDA plot of the differential bacterial by LEfSe analysis; (B) clodagram of the differential bacteria lby LEfSe analysis.
