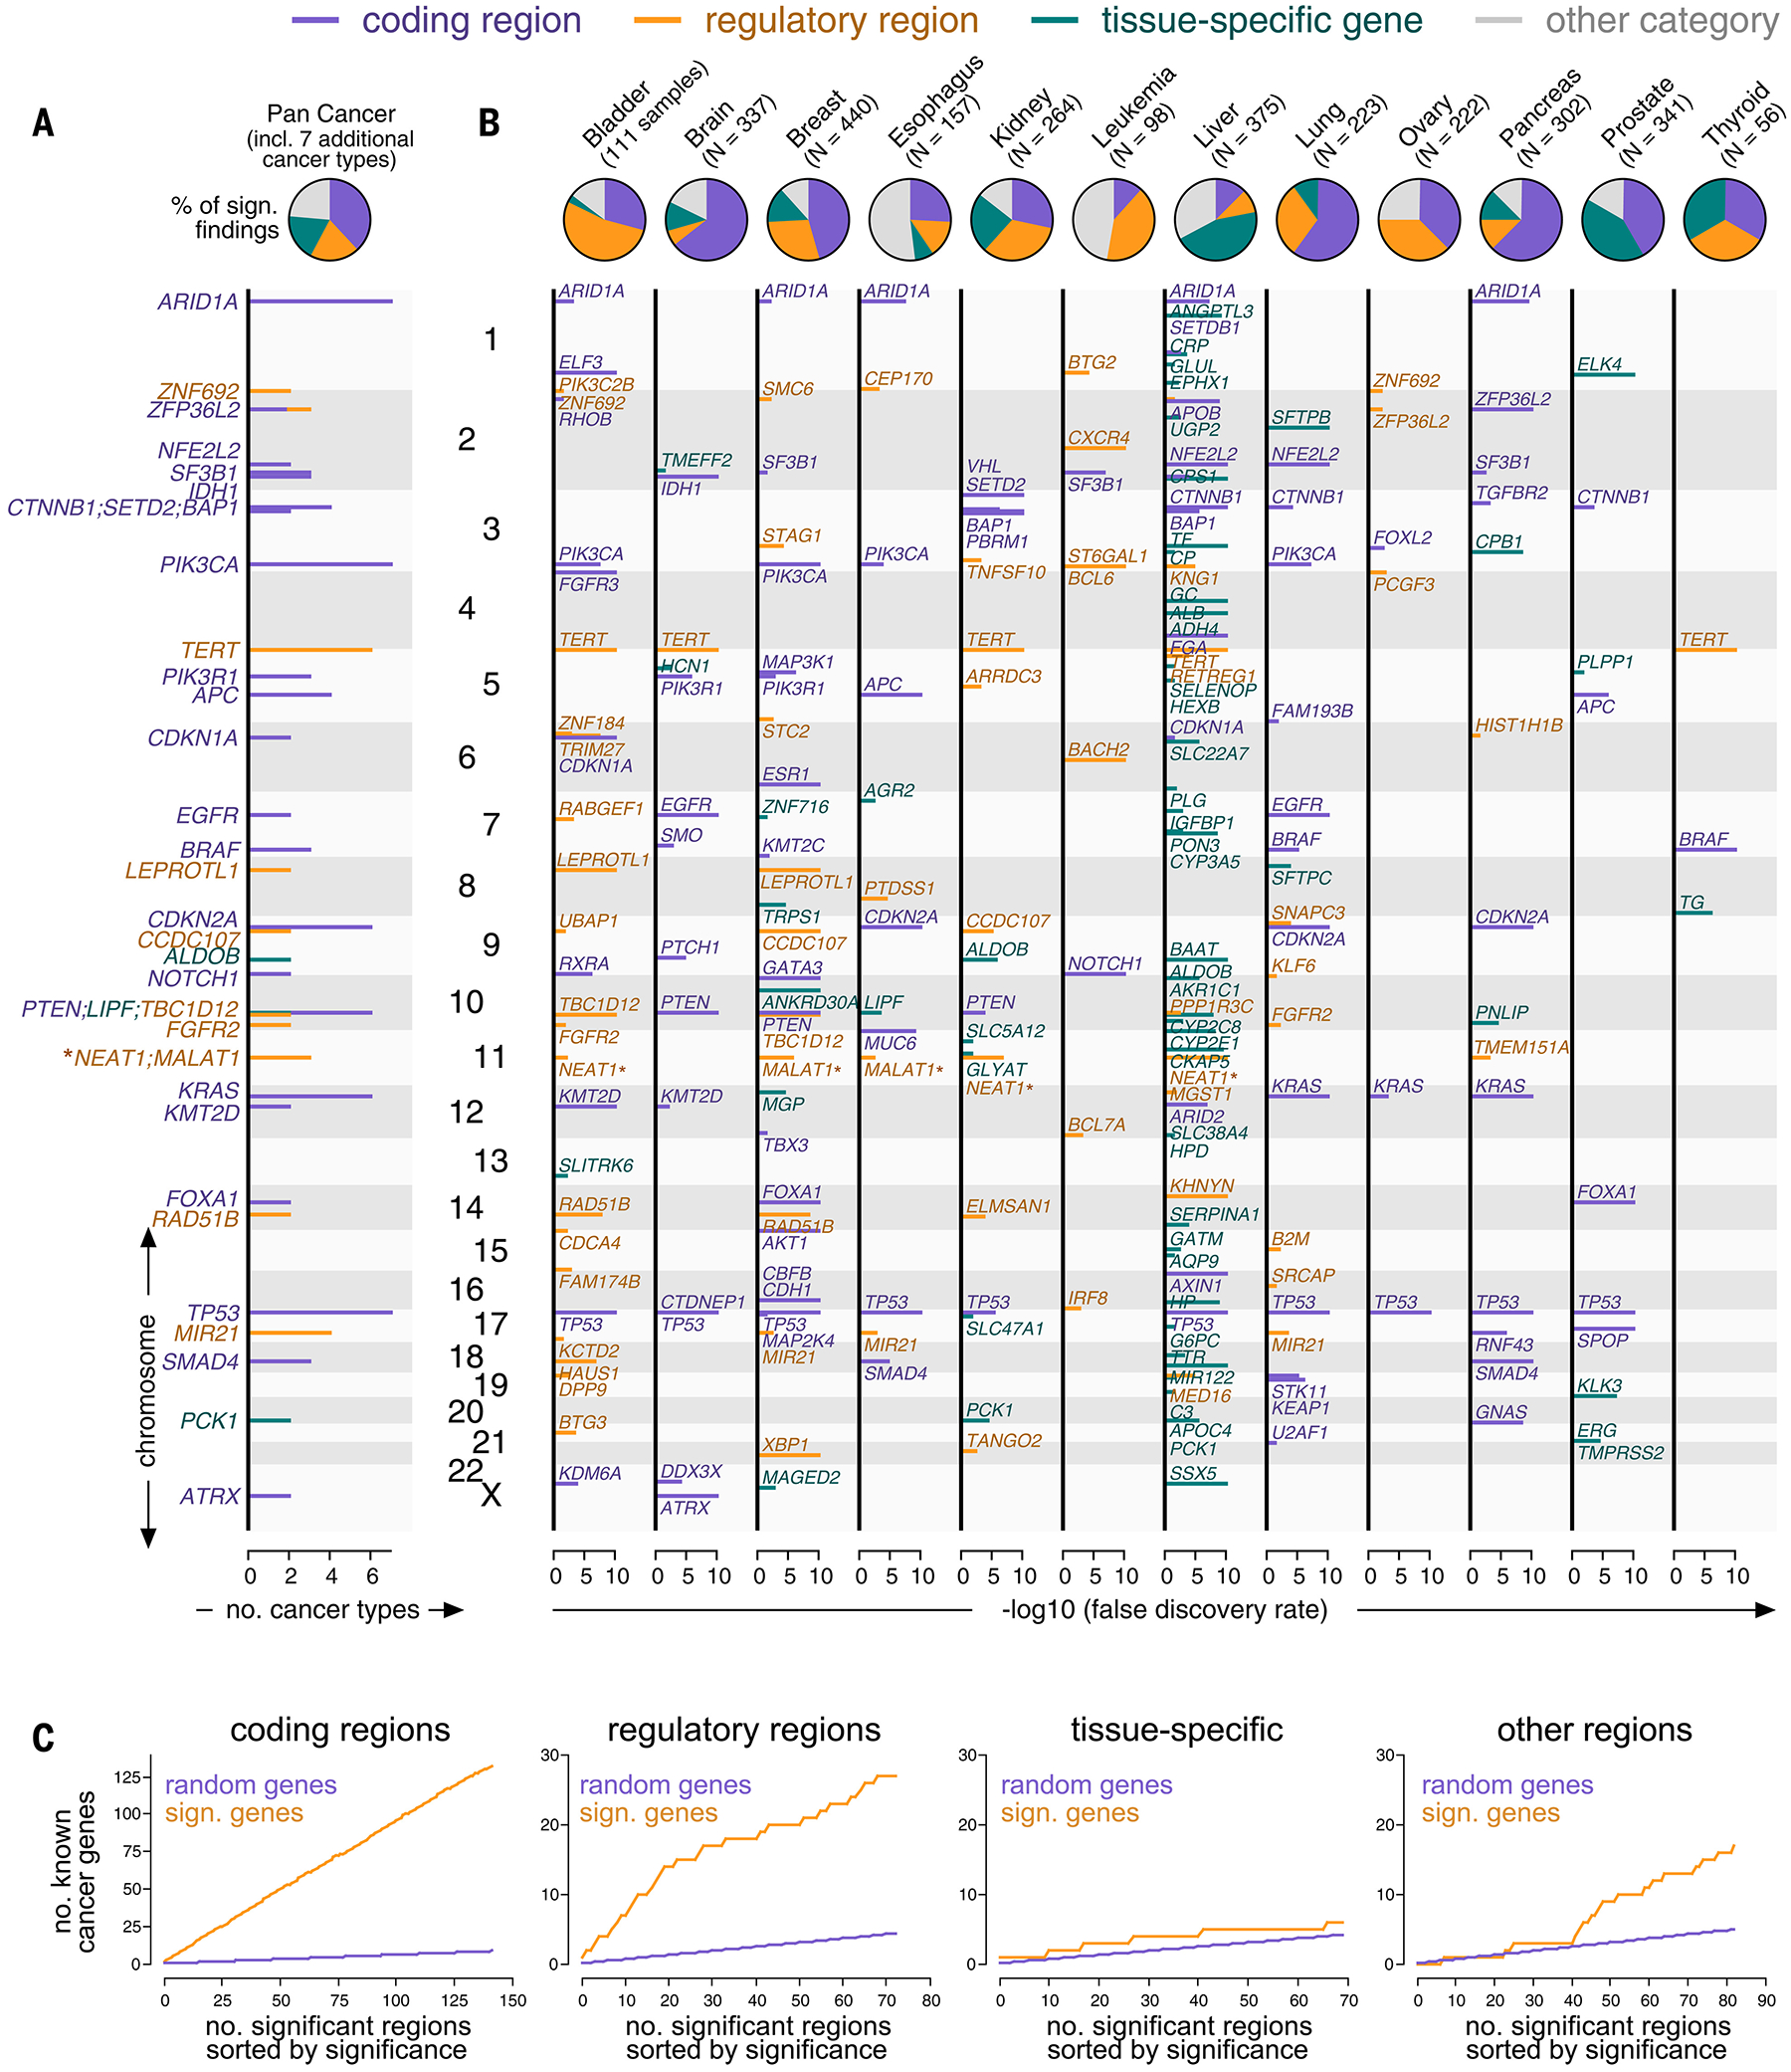
FIG. 2.

Mutation events identified in a genome-wide analysis of the PCAWG and HMF consortia. (A and B) Top: Pie charts showing the number of mutation events per category (purple: coding, orange: regulatory, teal: tissue-specific, gray: other) in aggregate (A) and individual cancer types (B). Bottom: Genomic positions (y-axis) plotted against their significance in a genome-wide analysis (x-axis) and colored by categories (B). The position (y-axis) of findings recurring in more than one cancer type is plotted against the number of cancer types (x-axis) (A). NEAT1 and MALAT1 are marked by asterisks because their classification was ambiguous. (C) Mutation events sorted by their significance in a genome-wide analysis (x-axis, orange) and plotted against the number of findings involving known cancer genes (y-axis, top). Random overlap between findings and cancer genes serves as a negative control (purple).
