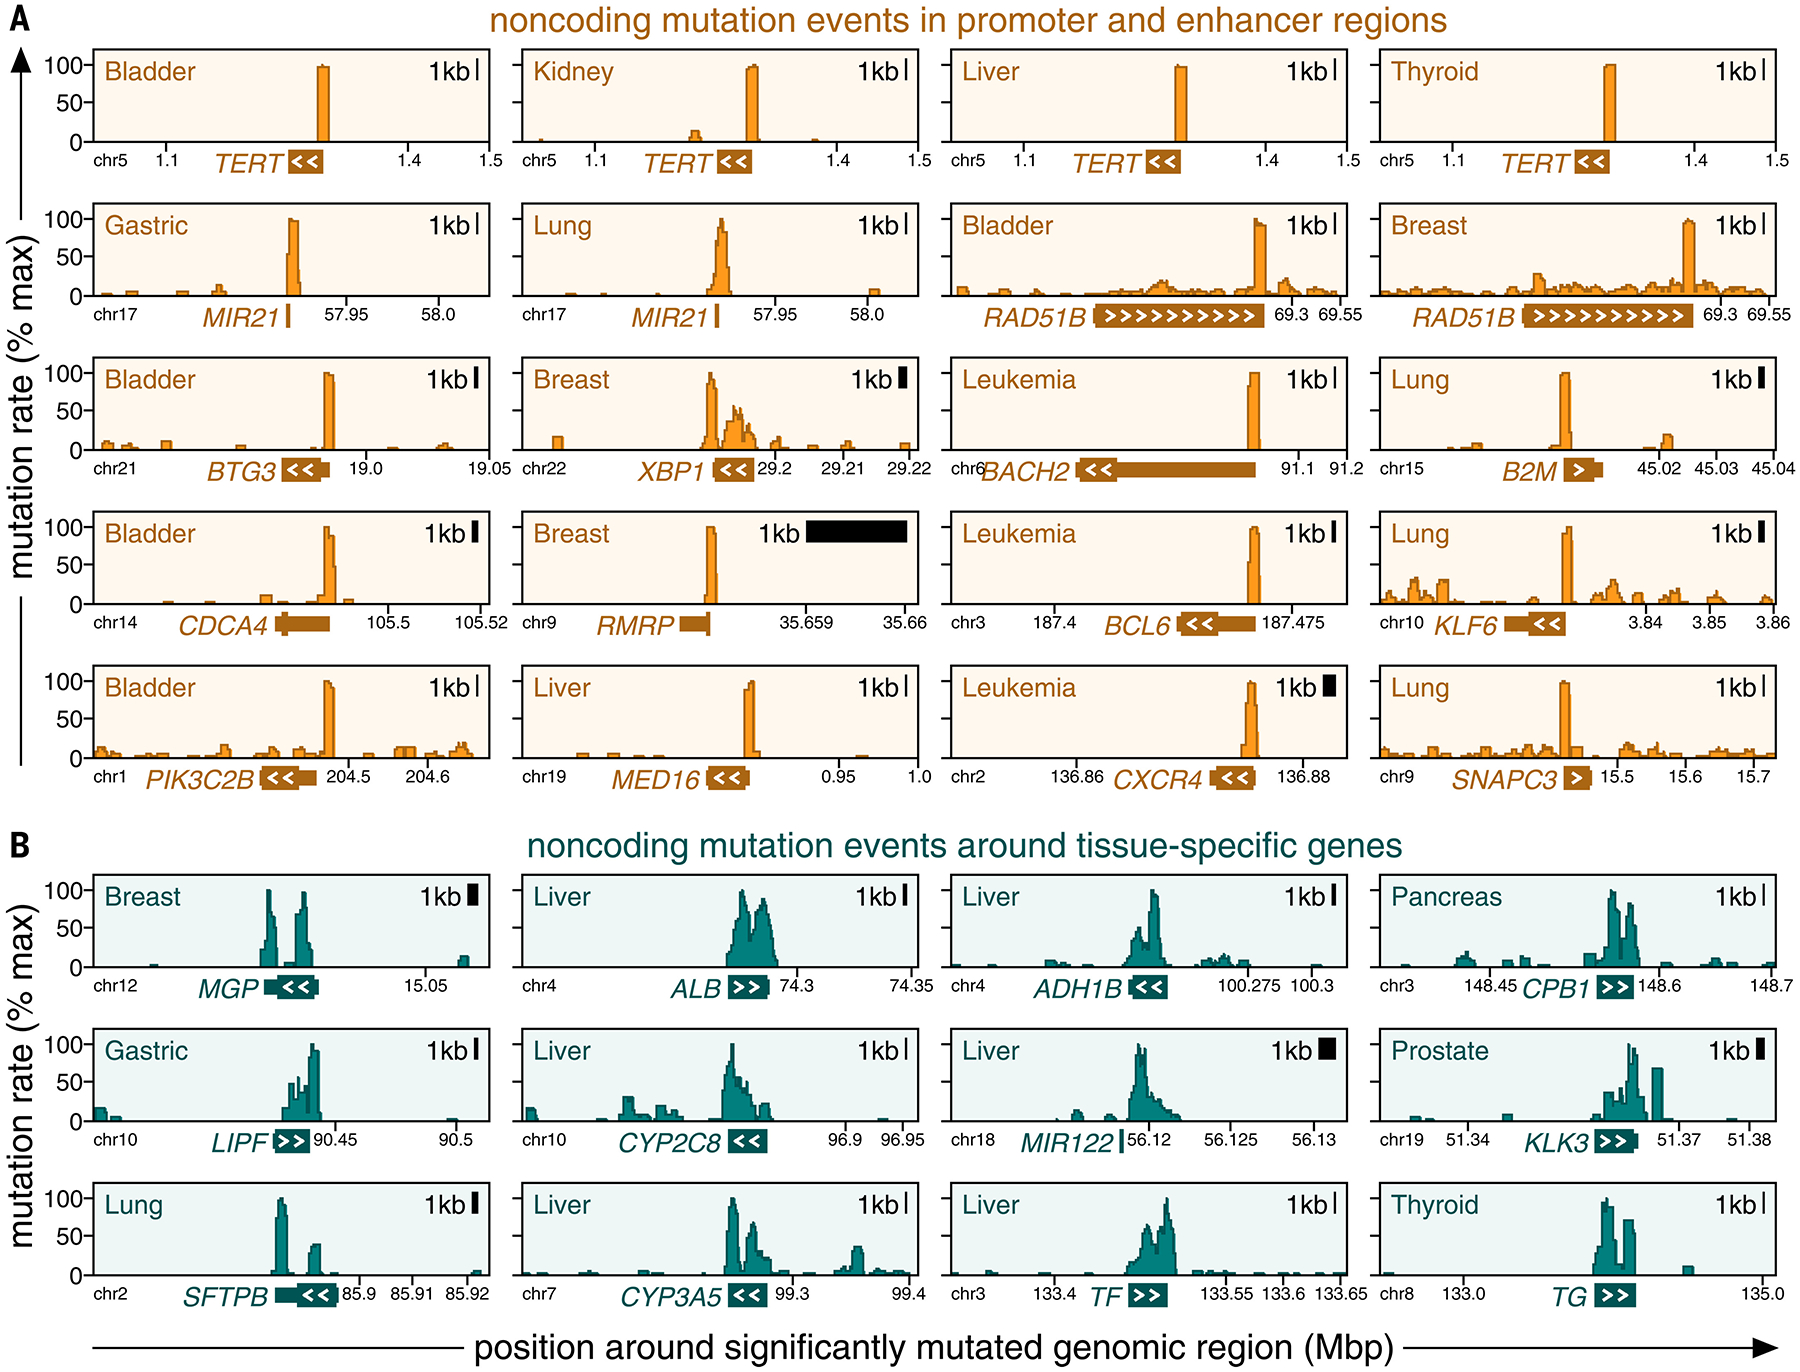
FIG. 3.

Categories of mutation events exhibit different mutation patterns. Positional clustering of mutations (y-axis, percentage of maximum) is plotted against genomic positions (x-axis) around mutation events that fall into regulatory regions [(A), orange] or overlap with tissue-specific genes [(B), teal]. Genomic boundaries of the closest gene are marked at the bottom of each plot, and white arrowheads mark the direction of its transcription.
