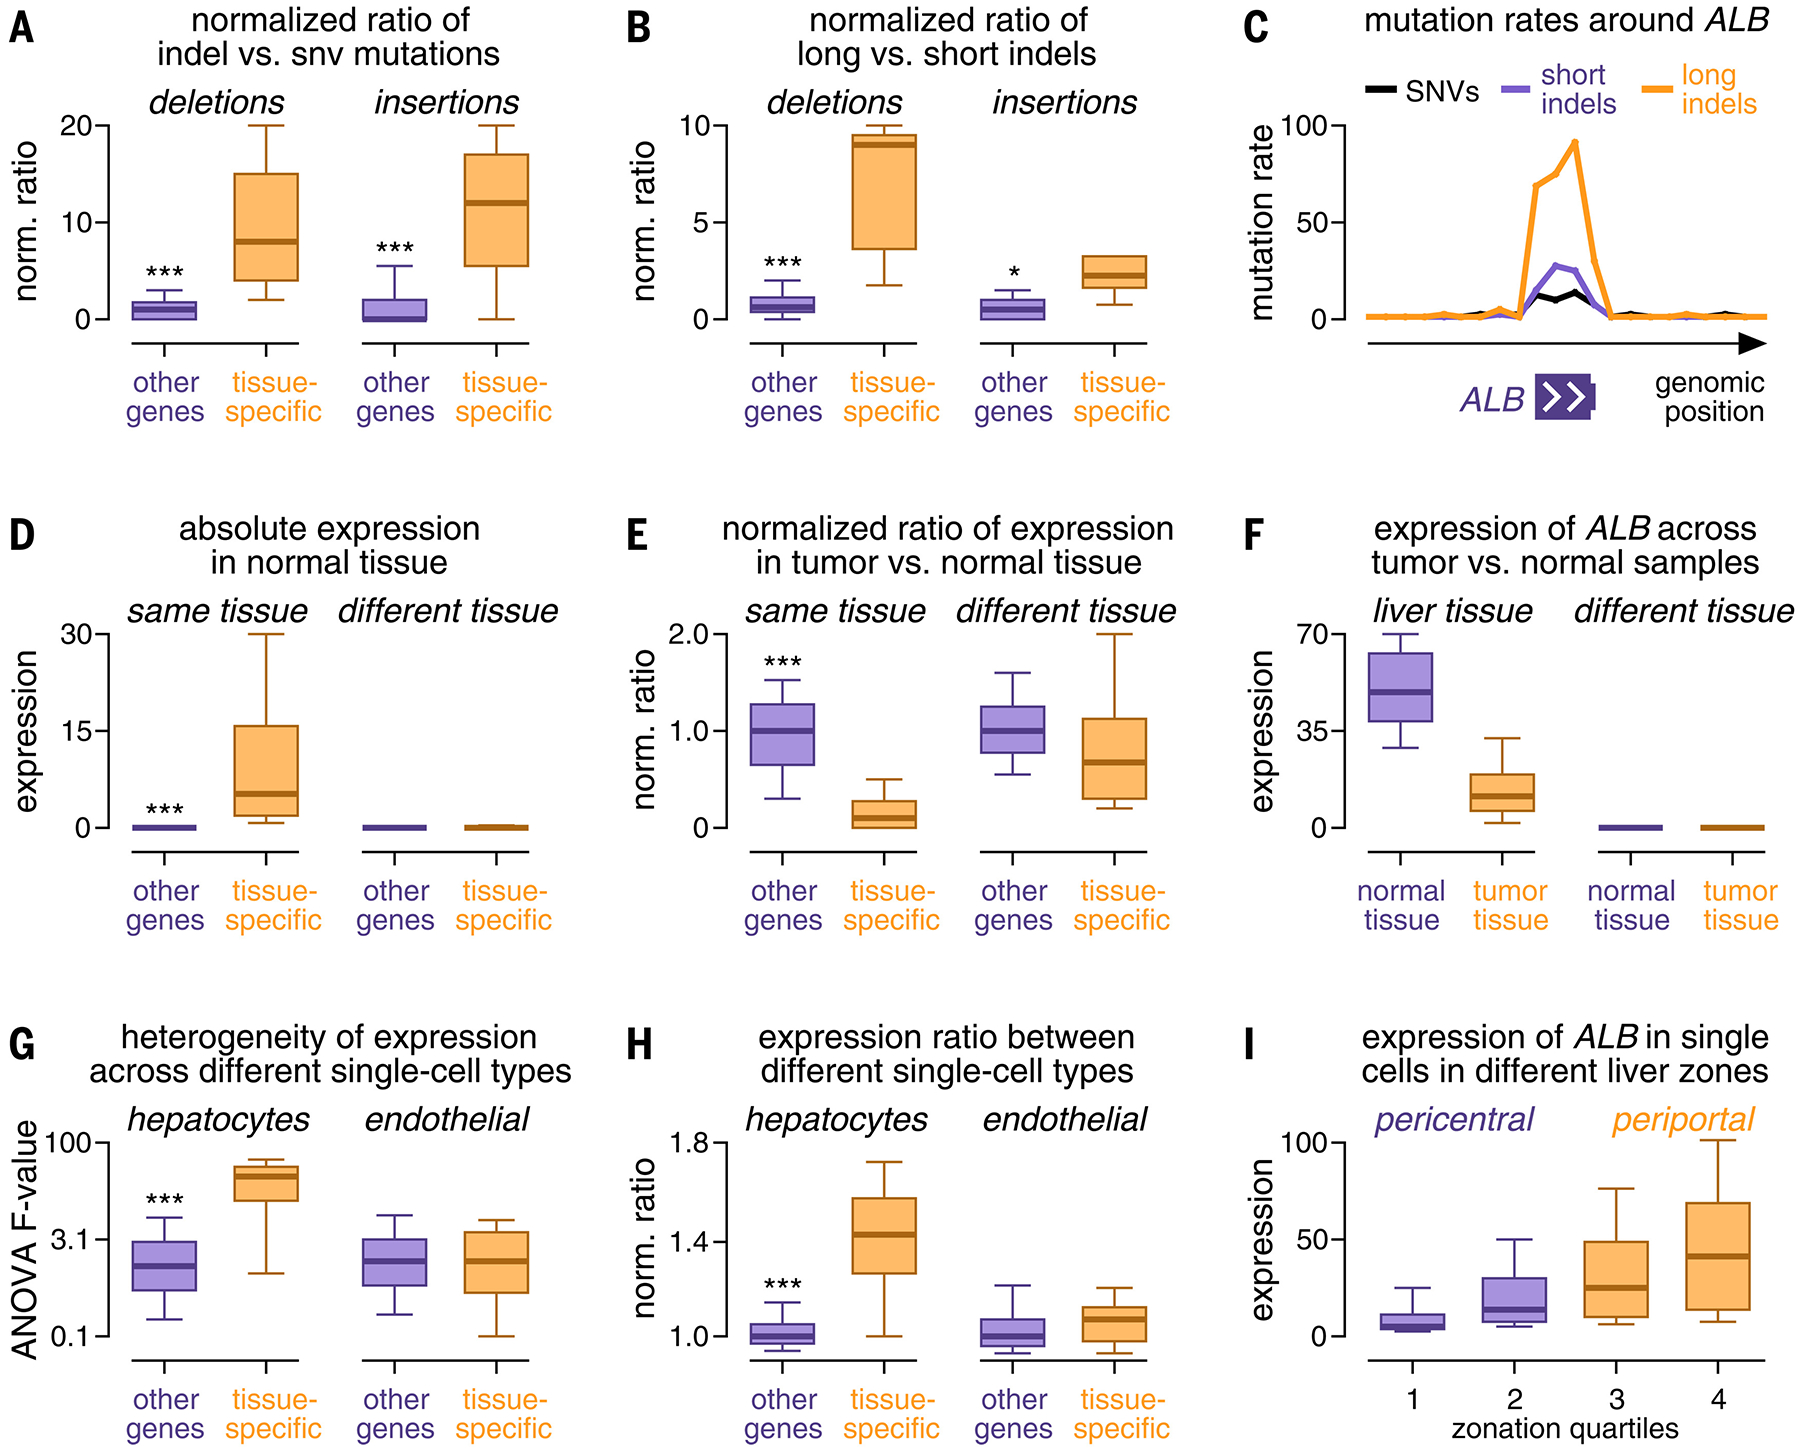
FIG. 4.

Characterization of the expression and mutation patterns of tissue-specific genes. (A and B) Box plots comparing the ratio of the number of indels to single-nucleotide variants (SNVs) (A) and the ratio of the number of long to short indels (B) between tissue-specific genes (orange) and other genes (purple). (C) Mutation rates of SNVs (black), short indels (purple), and long indels (orange) (y-axis, percentage of maximum) plotted against their genomic position around ALB (x-axis). (D and E) Box plots comparing the expression (D) and expression ratio in tumor versus normal tissue (E) of tissue-specific genes (orange) and other genes (purple). (F) Box plots comparing ALB expression (y-axis) between samples from tumor tissue (orange) and normal tissue (purple). (G and H) Box plots comparing heterogeneous expression of tissue-specific genes (orange) and other genes (purple) in single-cell data of hepatocytes (left) and endothelial cells (right) based on an analysis of variance (ANOVA) test (G) and the expression ratio between cell types (H). (I) Box plots comparing ALB expression in cells from different histological zones of the liver (x-axis). Boxes in (A) to (I) indicate the 25/75% interquartile range, vertical lines extend to 10/90% percentiles, and horizontal lines reflect distribution medians. Significant differences (Mann-Whitney U test) are marked with asterisks: *P < 0.05, **P < 0.01, ***P < 0.001.
