FIG. 5.

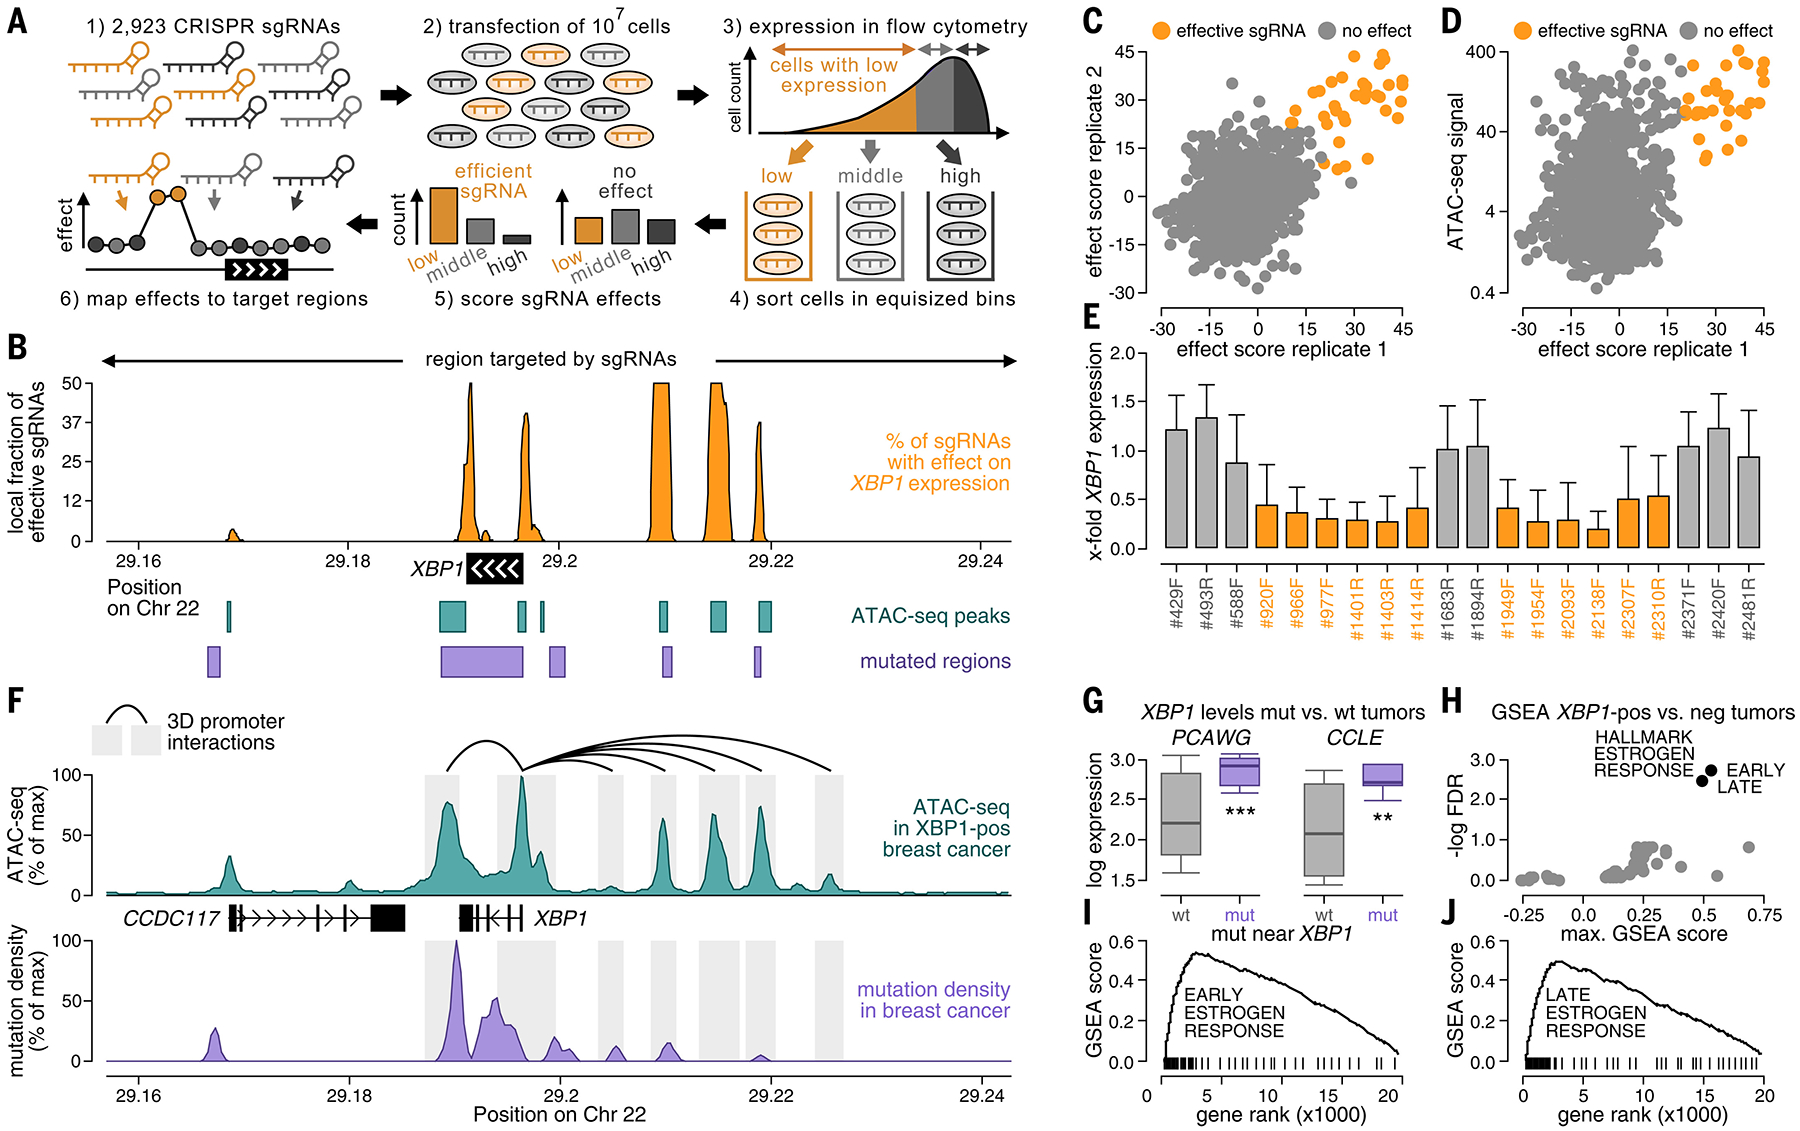
Noncoding somatic mutations occur in regulatory regions around XBP1. (A) CRISPRi screening of regions around XBP1 using a library of 2923 sgRNAs in breast cancer cells (CAMA1). Regulatory regions were localized based on sgRNAs, for which KRAB-mediated silencing of their target region led to decreased XBP1 expression in flow cytometry (orange). (B) Fractions of effective sgRNAs (y-axis) plotted against their position around XBP1 (x-axis). Positions of ATAC-seq peaks (teal, bottom), noncoding mutations (purple, bottom), and target regions of the sgRNAs (top) are annotated. (C and D) Efficacies of sgRNAs (sliding window of 10 adjacent sgRNAs) compared between experimental replicates [x-axis versus y-axis (C)] and the ATAC-seq signal of their target regions in breast cancer [y-axis (D)]. (E) Bar graphs displaying the XBP1 expression ratio before and after CRISPRi in regulatory regions (orange) and nonregulatory regions (gray) for individual sgRNAs. Error bars reflect the SD across cells. (F) Mutation densities (purple), ATAC-seq signals (teal), and three-dimensional interactions in the breast cancer genome of MCF7 (ChIA-PET, black) plotted against their genomic position around XBP1 (x-axis). (G) XBP1 expression compared between breast tumors with [purple, mutated (mut)] and without [gray, wild-type (wt)] mutations around XBP1 in PCAWG (left) and CCLE (right). Boxes indicate the 25/75% interquartile range, vertical lines extend to 10/90% percentiles, and horizontal lines reflect distribution medians of XBP1 expression. Significant differences (Mann-Whitney U test) are annotated with asterisks: *P < 0.05, **P < 0.01, ***P < 0.001. (H) Gene Set Enrichment Analysis analyzing expression differences in tumors with high versus low XBP1 expression by computing an enrichment score (x-axis) and a significance value (y-axis) for each hallmark signature. For (I) and (J), gene ranks (x-axis) are plotted against enrichment scores (y-axis) for early (I) and late (J) estrogen response signatures (black).
