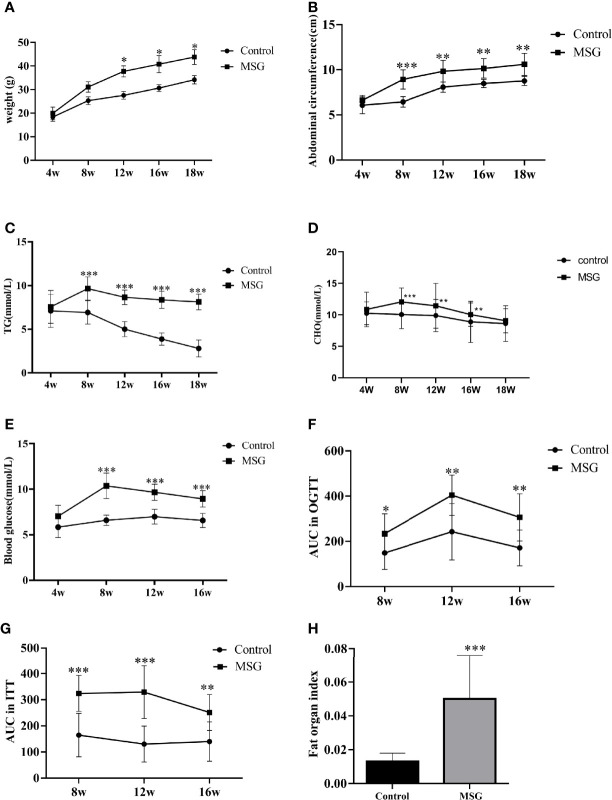
Figure 4.
Characteristics of the MSG mouse model. (A) Weight change curves of the normal control group and MSG mice. (B) Abdominal circumference curve of the normal control group and MSG mice. (C) Changes of serum TG in the normal control group and MSG mice at different time points. (D) CHO change curves in serum of the normal control group and MSG mice at different time points. (E) Changes of fasting blood glucose in the normal control group and MSG mice at different time points. (F) Area under OGTT curve (AUC) of oral glucose tolerance of the normal control group and MSG mice at 8, 12, and 16W. (G) Area under insulin tolerance (ITT) curve (AUC) of the normal control group and MSG mice at 8, 12, and 16W. (H) Fat index of the normal control group and MSG mice at dissection vs. control group: *p < 0.05, **p < 0.01, ***p < 0.001.

