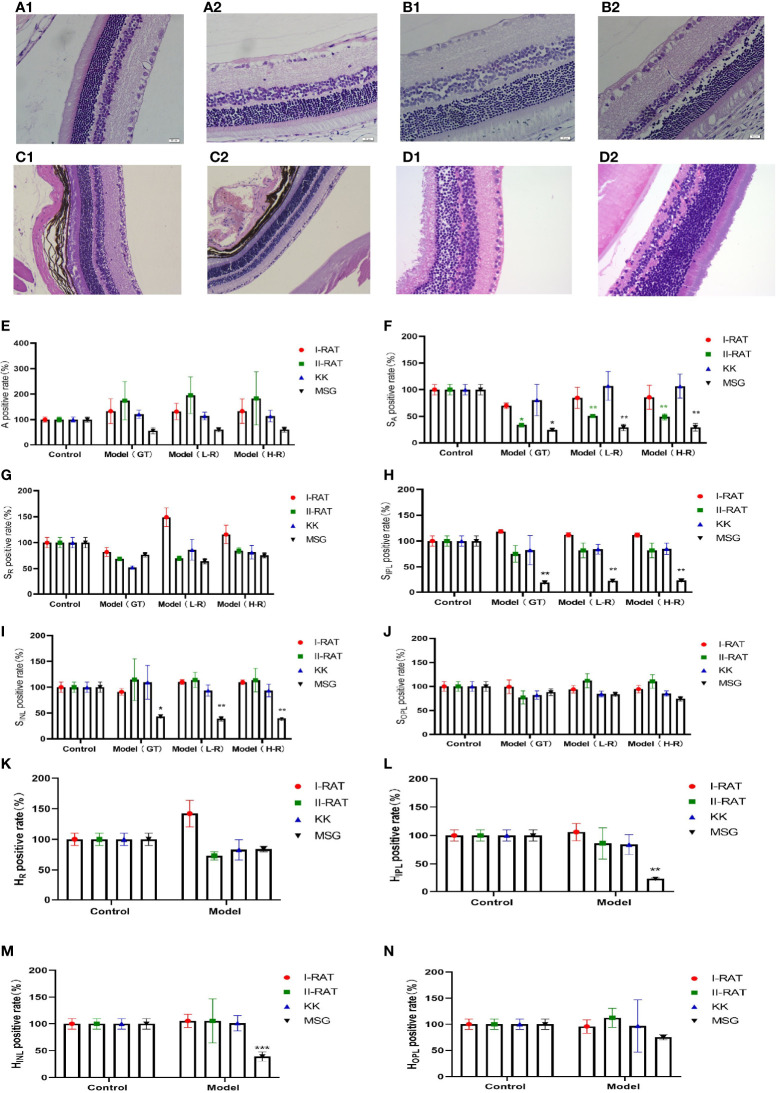
Figure 7.
Comparison of the characteristics of retinopathy in diabetic animal models. (A1) Retinal HE section images of type 1 diabetic rats. (A2) Retinal HE section images of SD rats. (B1) Retinal HE section images of type 2 diabetic rats. (B2) Retinal HE section images of SD rats. (C1) HE section image of C57 mouse retina. (C2) HE section image of KK mouse retina. (D1) HE section image of ICR mouse retina. (D2) HE section image of MSG mouse retina. (E) Comparative images of positive retinal ganglion cell numbers in four groups. (F–J) The positive rate of the retinal layer area in four groups was compared. (K–N) Comparative images of positive rate of retinal thickness in four groups. A is the number of ganglion cells, SA is the total area of ganglion cells, SR is the area of retinal nerve fiber layer (RNFL), SIPL is the area of internal layer (IPL), SINL is the area of kernel layer (INL), SOPL is the area of external network layer (OPL). HR is the thickness of retinal nerve fiber layer (RNFL), HIPL is the thickness of the internal layer (IPL), HINL is the thickness of kernel layer (INL), and HOPL is the thickness of the external network layer (OPL). Red are type 1 diabetic rats, green are type 2 diabetic rats, blue are KK mice, and black are MSG mice. GT is the result of manual interpretation; L-r is the result of low resolution image AI interpretation; H-r is the result of AI interpretation of the high-resolution image. The Control group for each method is considered 100% vs. control group: *p < 0.05, **p < 0.01, ***p < 0.001.

