. 2018 Dec 18;8(73):42246–42252. doi: 10.1039/c8ra09298b

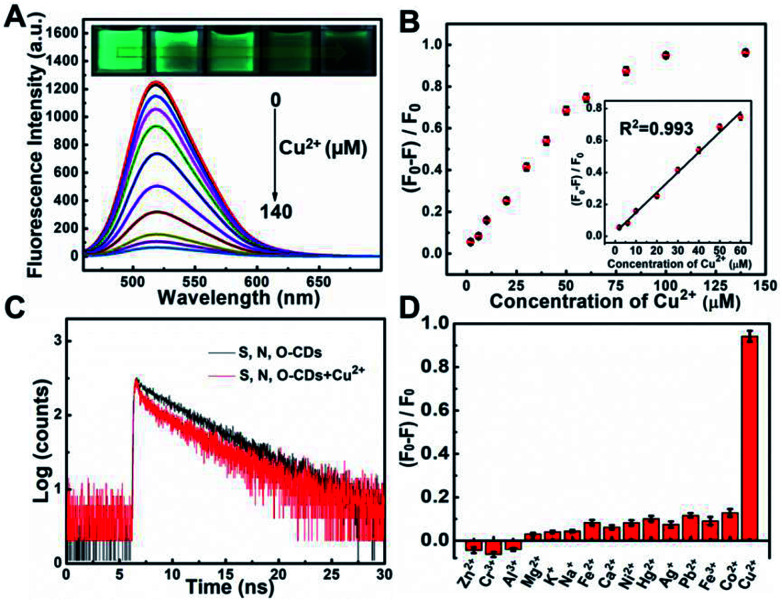
Fig. 3. (A) Fluorescence spectra of S, N, O-CDs upon addition of various concentrations of Cu2+ from 0 to 140 μM. Insets represent green fluorescence changes of S, N, O-CDs in the presence of different concentrations of Cu2+. (B) Plots of (F0F)/F0 with different concentrations of Cu2+. Inset: linear calibration curve between (F0F)/F0 and various concentrations of Cu2+. F0 and F represent the fluorescence of S, N, O-CDs in the absence and in the presence of Cu2+, respectively. (C) Fluorescence lifetime decay of S, N, O-CDs in the absence and in the presence of Cu2+. (D) Comparison of S, N, O-CDs after addition of various metal ions at a concentration of 100 μM.

Fig. 3