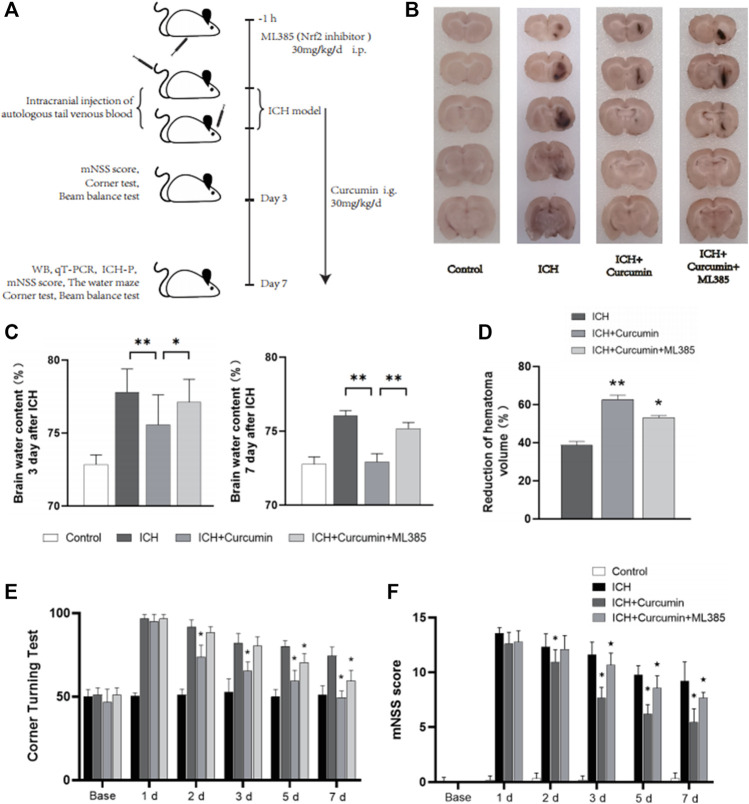
FIGURE 6.
In vivo experimental procedures and neurological function evaluation. (A) Graphical abstract of the in vivo study. (B) The coronal sections of the brain tissue were prepared following sucrose dehydration (5 mm), to evaluate intracranial hematoma. (C) The cerebral water content was measured 3 and 7 d after ICH. (D) The reduction in the hematoma volume is reported as a percentage. (E) Statistical analysis of the corner turn test. (F) The mNSS score of rats in each group. The data are shown as the means ± SD of n = 3 samples/group and at least three independent experiments were performed. Statistical analyses were conducted using two-way ANOVA. Compared with ICH group, *, p < 0.01 and **, p < 0.01. Compared with ICH + Curcumin group, ★, p < 0.01.

