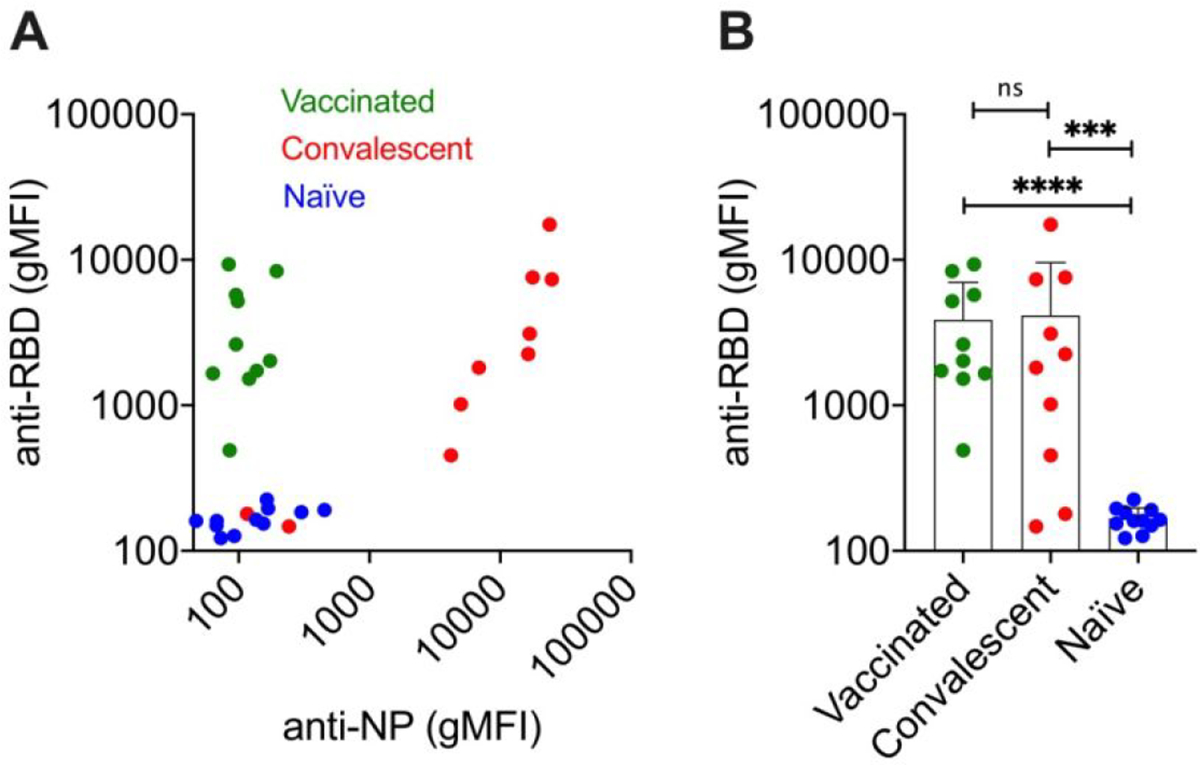
Figure 2. Anti-RBD and anti-N-protein levels in donors’ sera.

A) anti-RBD and anti-N-protein antibody (IgG) levels (geometric mean fluorescence intensity gMFI, average of 3 technical replicates) by flow cytometry-based immunoassay (Methods); B) comparison of anti-RBD IgG levels in 3 donor groups (full statistical analysis in Supplemental Table 1; n=10 vaccinated, 10 convalescent and 11 naïve donors; ***p<0.001; ****p<0.0001).
