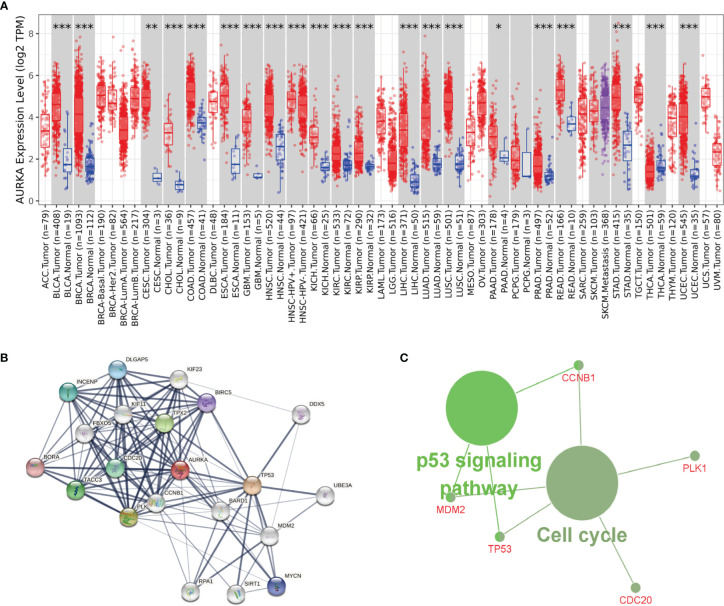
Figure 7.
AURKA’s biological involvement in tumors. (A) AURKA expression in different tumors. (B) AURKA gene STRING interaction network preview of interacting proteins (showing top 20 STRING interactants). (C) Illustration of KEGG pathway analysis findings using the ClueGO plugin in Cytoscape. *P < 0.05, **P < 0.01, ***P < 0.001.

