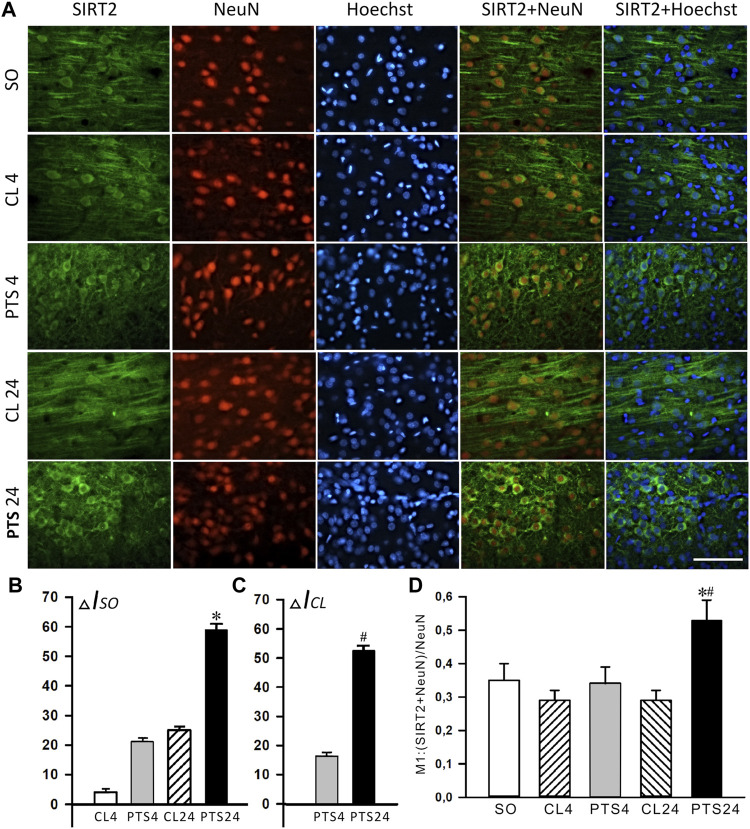
FIGURE 5.
SIRT2 levels and localization in the neurons of ischemic penumbra 4 and 24 h after photothrombotic stroke in the rat cerebral cortex (PTS4 and PTS24, respectively) compared to the same animals’ contralateral cortex (CL4 and CL24), or the cortex of sham-operated animals (SO). (A) Immunofluorescence of SIRT2 (green), neuronal marker NeuN (red), nuclear chromatin marker Hoechst 33342 (blue), and image overlay. The scale bar is 100 μm. (B) Percent changes (ΔISO) of SIRT2 levels in the penumbra (PTS4 or PTS24) and the contralateral hemisphere (CL4 or CL24) compared to the brain cortex of sham-operated rats (SO) 4 or 24 h after PTS. (C) Percent changes (ΔICL) of SIRT2 levels in the penumbra (PTS4 or PTS24) compared to the contralateral cortex of the same rats 4 or 24 h after PTS. (D) Coefficient M1 of SIRT2 co-localization with the neuron marker (NeuN) in different control and experimental groups. One Way ANOVA; M ± SEM; n = 7.

