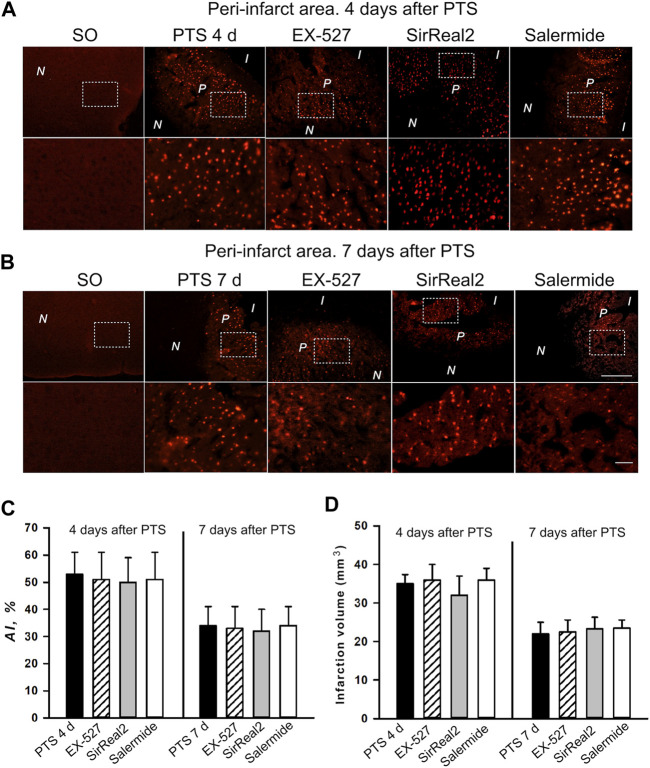
FIGURE 8.
Apoptosis in the PTS-induced peri-infarct area in the mouse cerebral cortex. (A,B) Typical images of cortical regions stained with TUNEL (red fluorescence) at 4 days (A) and 7 days (B) after PTS. Control: sham-operated animals (SO). Experimental groups: The cerebral cortex of mice injected by various inhibitors. Inhibitors: EX-527, a selective SIRT1 inhibitor; SirReal2, a selective SIRT2 inhibitor; salermide, a nonspecific inhibitor of SIRT1 and SIRT2. Scale bar 200 μm (C) Changes in the apoptotic index (AI, %) in the mice of experimental groups on day 4 and 7 after photothrombotic stroke and introduction of various inhibitors. (D) The effects of SIRT1 and SIRT2 inhibitors on the infarction core volume in the mouse brain at 4 and 7 days after photothrombotic stroke. Mean values of the infarction core volume (mm3) in the control group (PTS without inhibitors) and in the experimental groups (administration of inhibitors). Scale bar 1 cm. One Way ANOVA; M ± SEM; n = 7–10. *p < 0.05 compared with the PTS in the absence of inhibitors.

