. 2018 Dec 19;8(74):42322–42328. doi: 10.1039/c8ra05768k

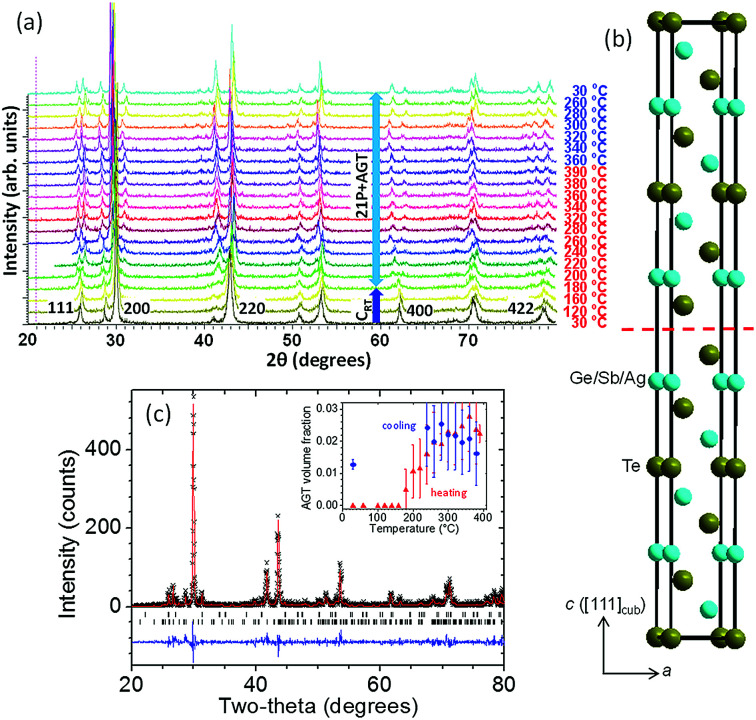
Fig. 2. High temperature structural properties of CRT phase of TAGS-85. (a) XRD patterns collected on initial heating of as-synthesized CRT phase from 30 °C to 390 °C (bottom to top), followed by cooling back to 30 °C. (b) Schematic representation of one unit cell of 21P structure. The red dashed line indicates a layer of Ge/Sb/Ag vacancies. (c) Observed (black data points), calculated (red line) and difference (blue line) XRD profiles of 21P phase (lower tick marks) with Ag8GeTe6 impurity (upper tick marks) at 20 °C after one heating + cooling cycle. The inset shows the evolution of the volume fraction of Ag8GeTe6 on initial heating (red) and subsequent cooling (blue).

Fig. 2