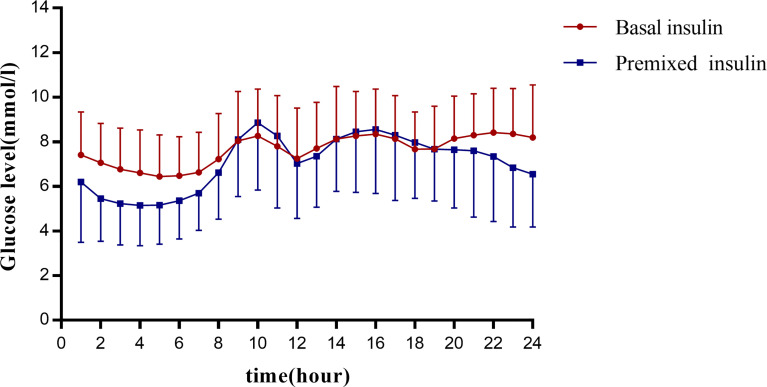
Figure 2.
Graph presents the glucose profiles of basal insulin and premixed insulin. The vertical coordinates show the mean glucose ± SD per hour for all patients in each group. The 24 points in each group are connecting to visualize the 24-hour glucose fluctuations in this group of patients. The horizontal coordinates are spaced at 2-hour intervals for each point.

