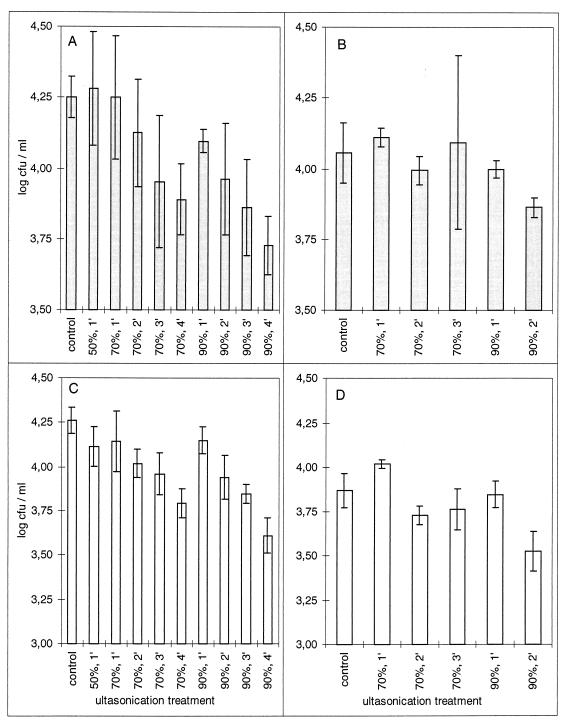
FIG. 2.
Effect of ultrasonication on the culturability of total (A and B) and fluorescent (C and D) epiphytic bacteria. Bars represent the mean population densities in three aliquots sonicated for each combination of time and amplitude. Error bars indicate the standard error. Panels A and C and panels B and D represent the results of two independent trials.

