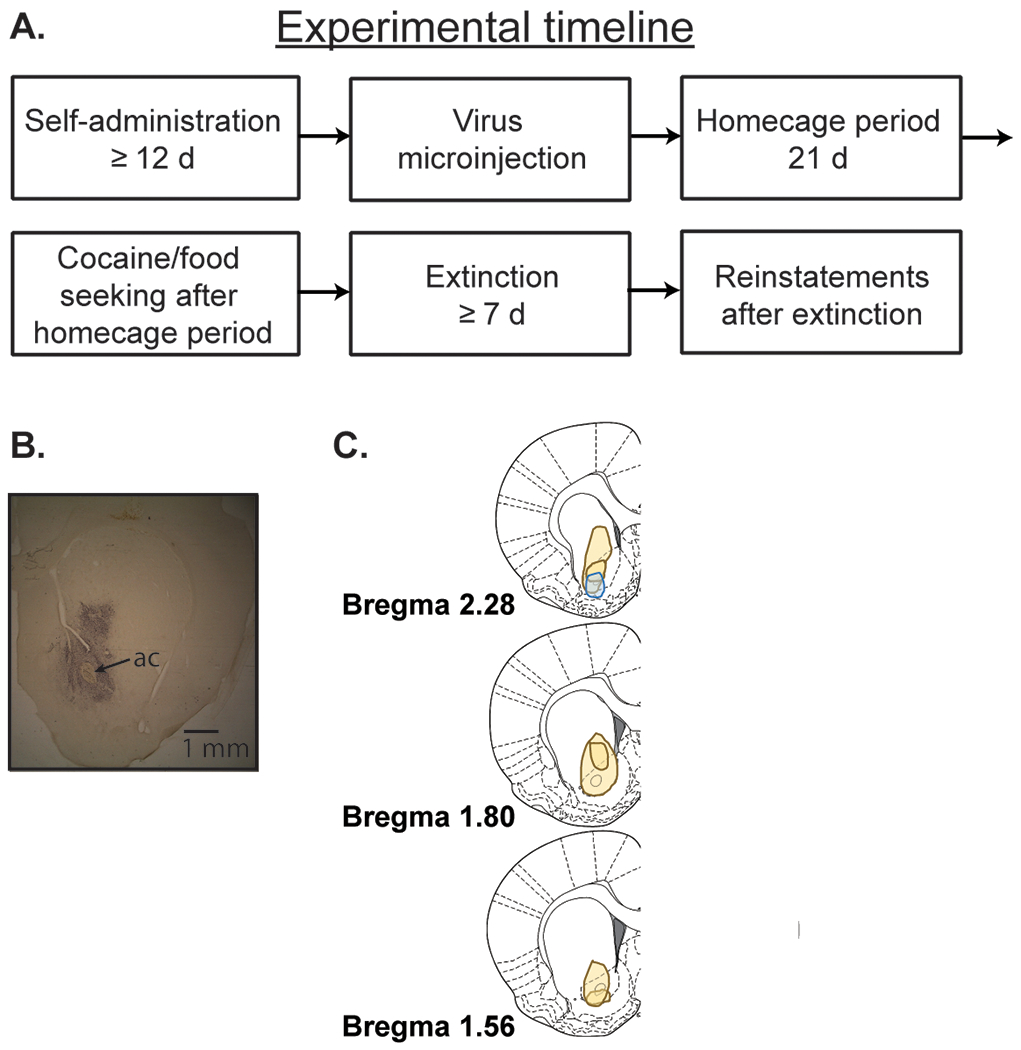
Figure 1.

A. Timeline for all experiments. B. Representative immunohistochemistry image showing virus expression in the NAcore. ac, anterior commissure. C. The left panel is a schematic showing the maximum and minimum observed spread of virus, as visualized by immunohistochemistry. The blue shape shows rats (n = 2) with viral spread into the NAshell.
