FIGURE 1.

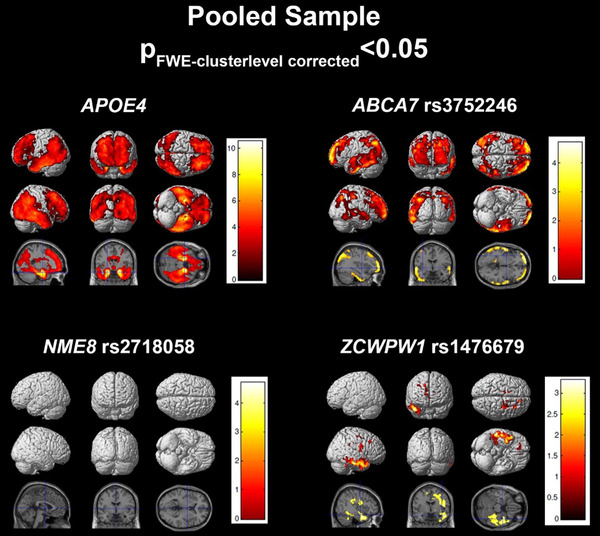
Regression results in the pooled sample. SPM visualization of association patterns for the regression selected significant or trending genes (P < .10). Results are displayed at a familywise error (few)‐cluster–level correction of P < .05

Regression results in the pooled sample. SPM visualization of association patterns for the regression selected significant or trending genes (P < .10). Results are displayed at a familywise error (few)‐cluster–level correction of P < .05