FIGURE 3.
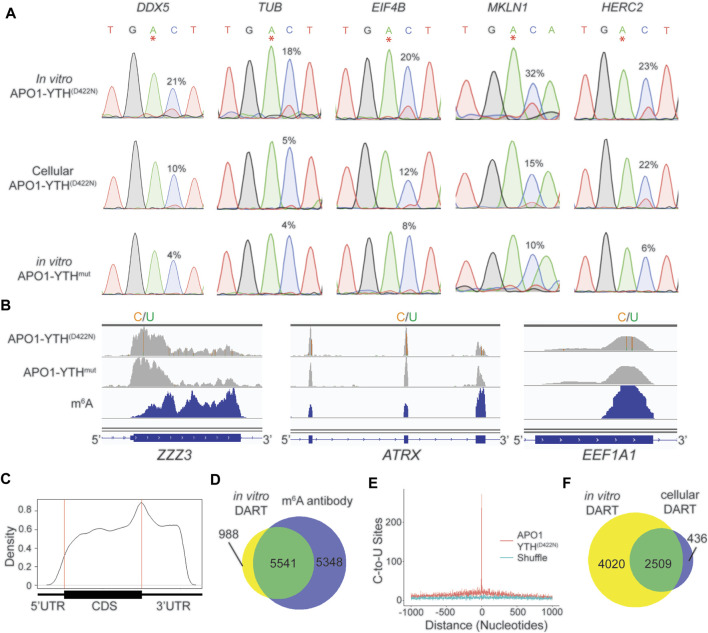
In vitro DART-seq identifies m6A transcriptome-wide. (A) Comparison of C-to-U editing rates in methylated mRNAs obtained by in vitro DART-seq and cellular DART-seq. Sanger sequencing traces show C-to-U editing adjacent to m6A sites in a panel of five methylated mRNAs: DDX5, TUB, EIF4B, MKLN1, and HERC2. m6A sites are indicated by asterisks. C-to-U editing rate (%U) is indicated above the adjacent cytidine. Data Representative of three biological replicates. (B) Genome browser tracks of in vitro DART-seq data showing C-to-U editing in three representative mRNAs: ZZZ3, ATRX, and EEF1A1. C-to-U editing found in at least 10% of the reads is indicated by green/yellow coloring. m6A peaks identified by MeRIP (Meyer et al., 2012) is indicated in the bottom blue track. (C) Metagene analysis of m6A sites identified by in vitro DART-seq using the APO1-YTHD422N protein. (D) Venn diagram showing the overlap between methylated RNAs identified by in vitro DART-seq filtered against the APO1-YTHmut negative control and methylated RNAs identified by antibody-based methods (Meyer et al., 2012; Schwartz et al., 2014; Lichinchi et al., 2016). (E) Absolute distance plot showing the distance of C-to-U editing sites identified by in vitro DART-seq relative to m6A sites identified by miCLIP (Linder et al., 2015). m6A sites are centered at position 0. (F) Venn diagram showing the overlap between methylated RNAs identified by in vitro DART-seq compared to methylated RNAs found by cellular DART-seq.

