. 2020 Mar 9;10(17):9940–9948. doi: 10.1039/c9ra10278g

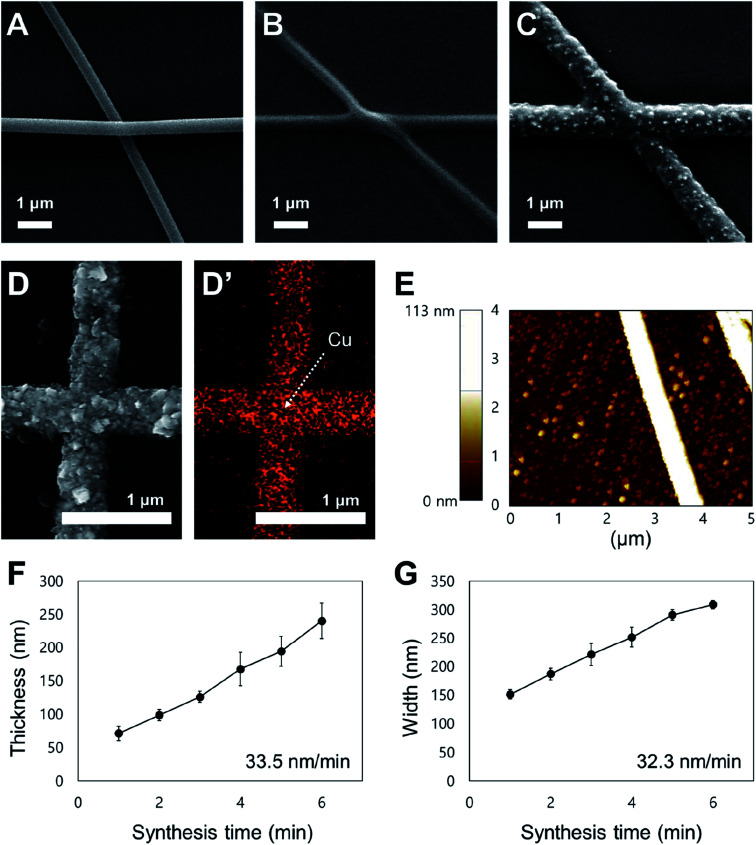
Fig. 2. Analysis of the copper nanofiber fabrication conditions and morphology. (A) SEM image of electrospun palladium-embedded polyvinylpyrrolidone (PVP) nanofibers. (B) SEM image of electrospun PVP nanofibers degraded by heat treatment. (C) SEM image of electroless deposited copper nanofibers. (D) Component analysis map used to analyze the fabricated copper nanofibers via energy dispersive X-ray spectroscopy (EDS). The red spots on the component analysis map shows the copper component. (E) Atomic force microscopy (AFM) image showing copper nanofiber thickness and morphology. (F) Graph of electroless deposition time against the thickness of the nanofibers (n = 5, mean ± standard error). (G) Graph of electroless deposition time against the width of the nanofibers (n = 5, mean ± standard error).

Fig. 2