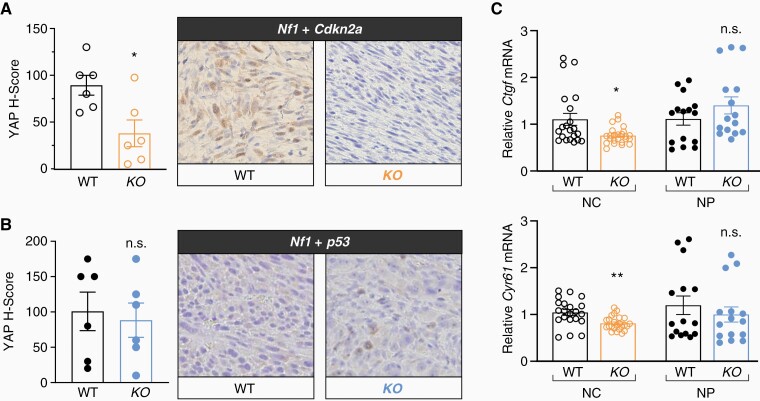
Figure 3.
RABL6A-null tumors display reduced YAP activity in a context-dependent manner. Representative YAP IHC images (200X magnification) from WT and Rabl6 KO mice in (A) Nf1 + Cdkn2a and (B) Nf1 + p53 primary MPNSTs with H-Score quantification graphed on the left. (C) Relative mRNA levels of YAP target genes, Ccn2 (Ctgf) (top) and Ccn1 (Cyr61) (bottom) from WT versus Rabl6 KO NC (Nf1 + Cdk2na) and NP (Nf1 + p53) edited tumors. YAP expression and activity (measured by downstream target expression) is decreased only in Nf1 + Cdkn2a Rabl6 KO tumors compared to WT, whereas Nf1 + p53 tumors remain the same. Error bars, SEM. P value, Student’s t-test for KO versus WT comparisons per genotype (*, P < .05; **, P < .01; n.s., not significant).

