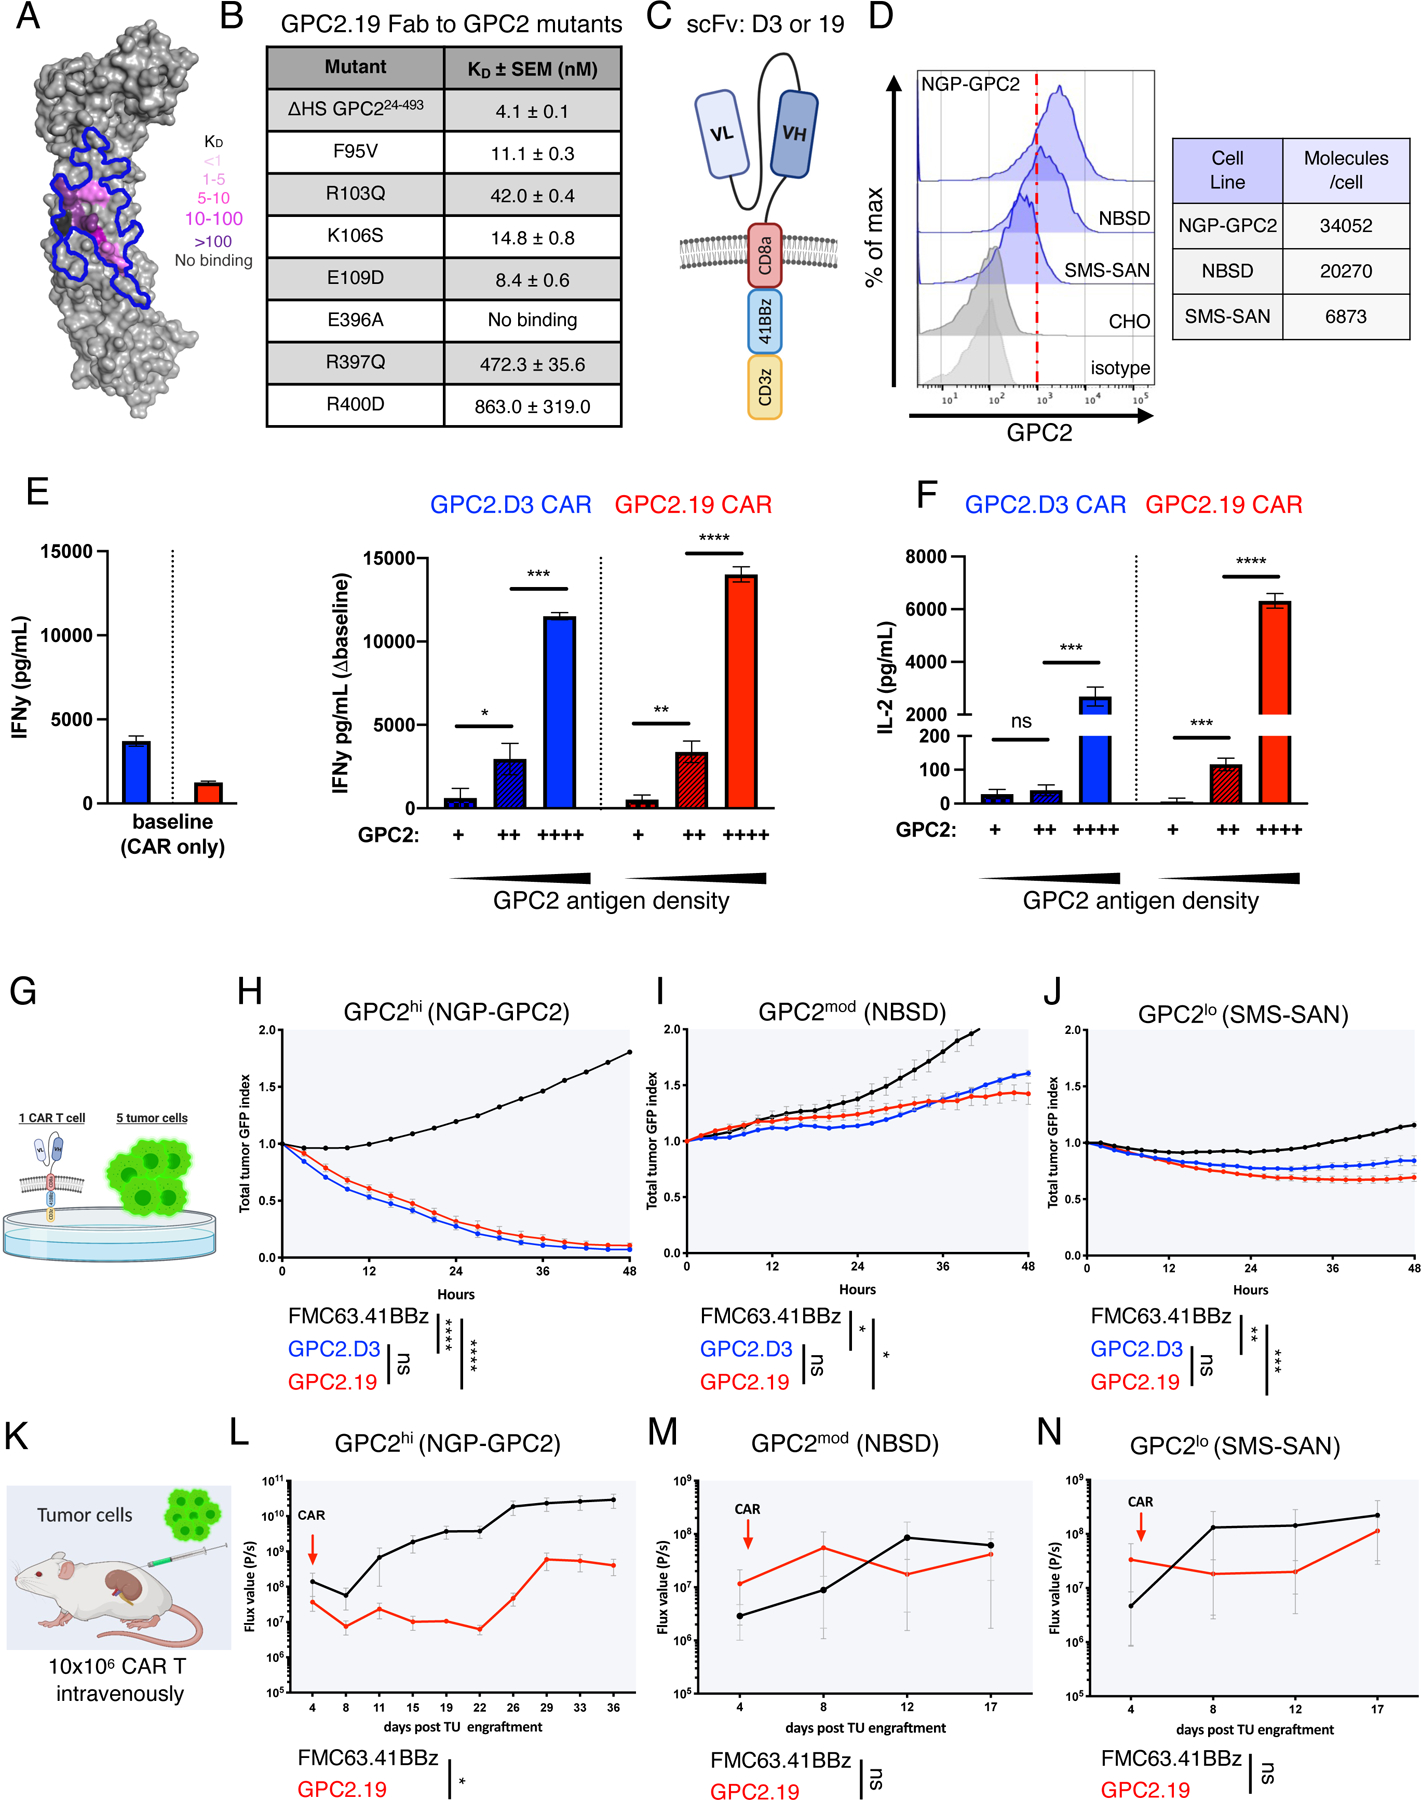
Figure 1. GPC2-CAR T cell efficacy is limited by GPC2 antigen density on NB.

A) Human GPC2 crystal structure (PDB ID: 6WJL) and effect of point mutations on GPC2.19 Fab binding affinity. Blue line delineates previously defined GPC2.D3 epitope.
B) Binding dissociation constants for GPC2.19 Fab binding to human GPC2 mutants.
C) Schematic of GPC2.8aTM.41BBz CAR constructs in VLVH orientation of scFv’s.
D) Flow cytometric cell surface expression of GPC2 on indicated NB cell lines and negative CTRL (CHO) and respective isotype CTRL. Representative histogram of n=4 independent experiments. Table shows molecules/cell of GPC2 as determined by QuantiBRITE PE assay.
E-F) Baseline levels of (E) IFNγ (left) and secretion of IFNγ (∆baseline, right) and (F) IL2 by GPC2-CAR T cells in response to NB cell lines shown in (D), with increasing antigen levels of GPC2. Representative of n=4 independent experiments (mean ± SD).
G) Schematic of in vitro killing assays at 1:5 effector:target ratio.
H-J) Cytolytic activity of GPC2.D3.8TM.41BBz- and GPC2.19.8TM.41BBz-CAR T cells in vitro against (H) NGP-GPC2 (I) NBSD and (J) SMS-SAN NB cell lines at 1:5 E:T ratio. Values represent mean ± SEM, representative of n=4 independent experiments.
K) Schematic of experimental outline testing GPC2.19.8TM.41BBz-CAR CAR T cells in para-orthotopic NB renal capsule xenograft models.
L-N) NGP-GPC2 post engraftment of 0.75 MIO tumor cells on day 0 and treated on day 4 (n=6 mice for CTRL.FMC63 and n=5 mice for GPC2.19 CAR T cells). M) NBSD or N) SMS-SAN post engraftment of 1 MIO tumor cells on day 0 and treated with CAR on day 5 (n=3 mice/group). For L-N): n=1 experiment each. Tumor burden assessed by IVIS imaging. Values represent FLUX [P/s] mean ± SEM.
Statistics: (E,F) represent Student’s t-test, (H-J) and (L-N) represent two-way RM-ANOVA (**** = p<0.0001, *** = p<0.001, ** = p<0.01, * = p<0.05), ns = p > 0.05).
See also Figures S1-2.
