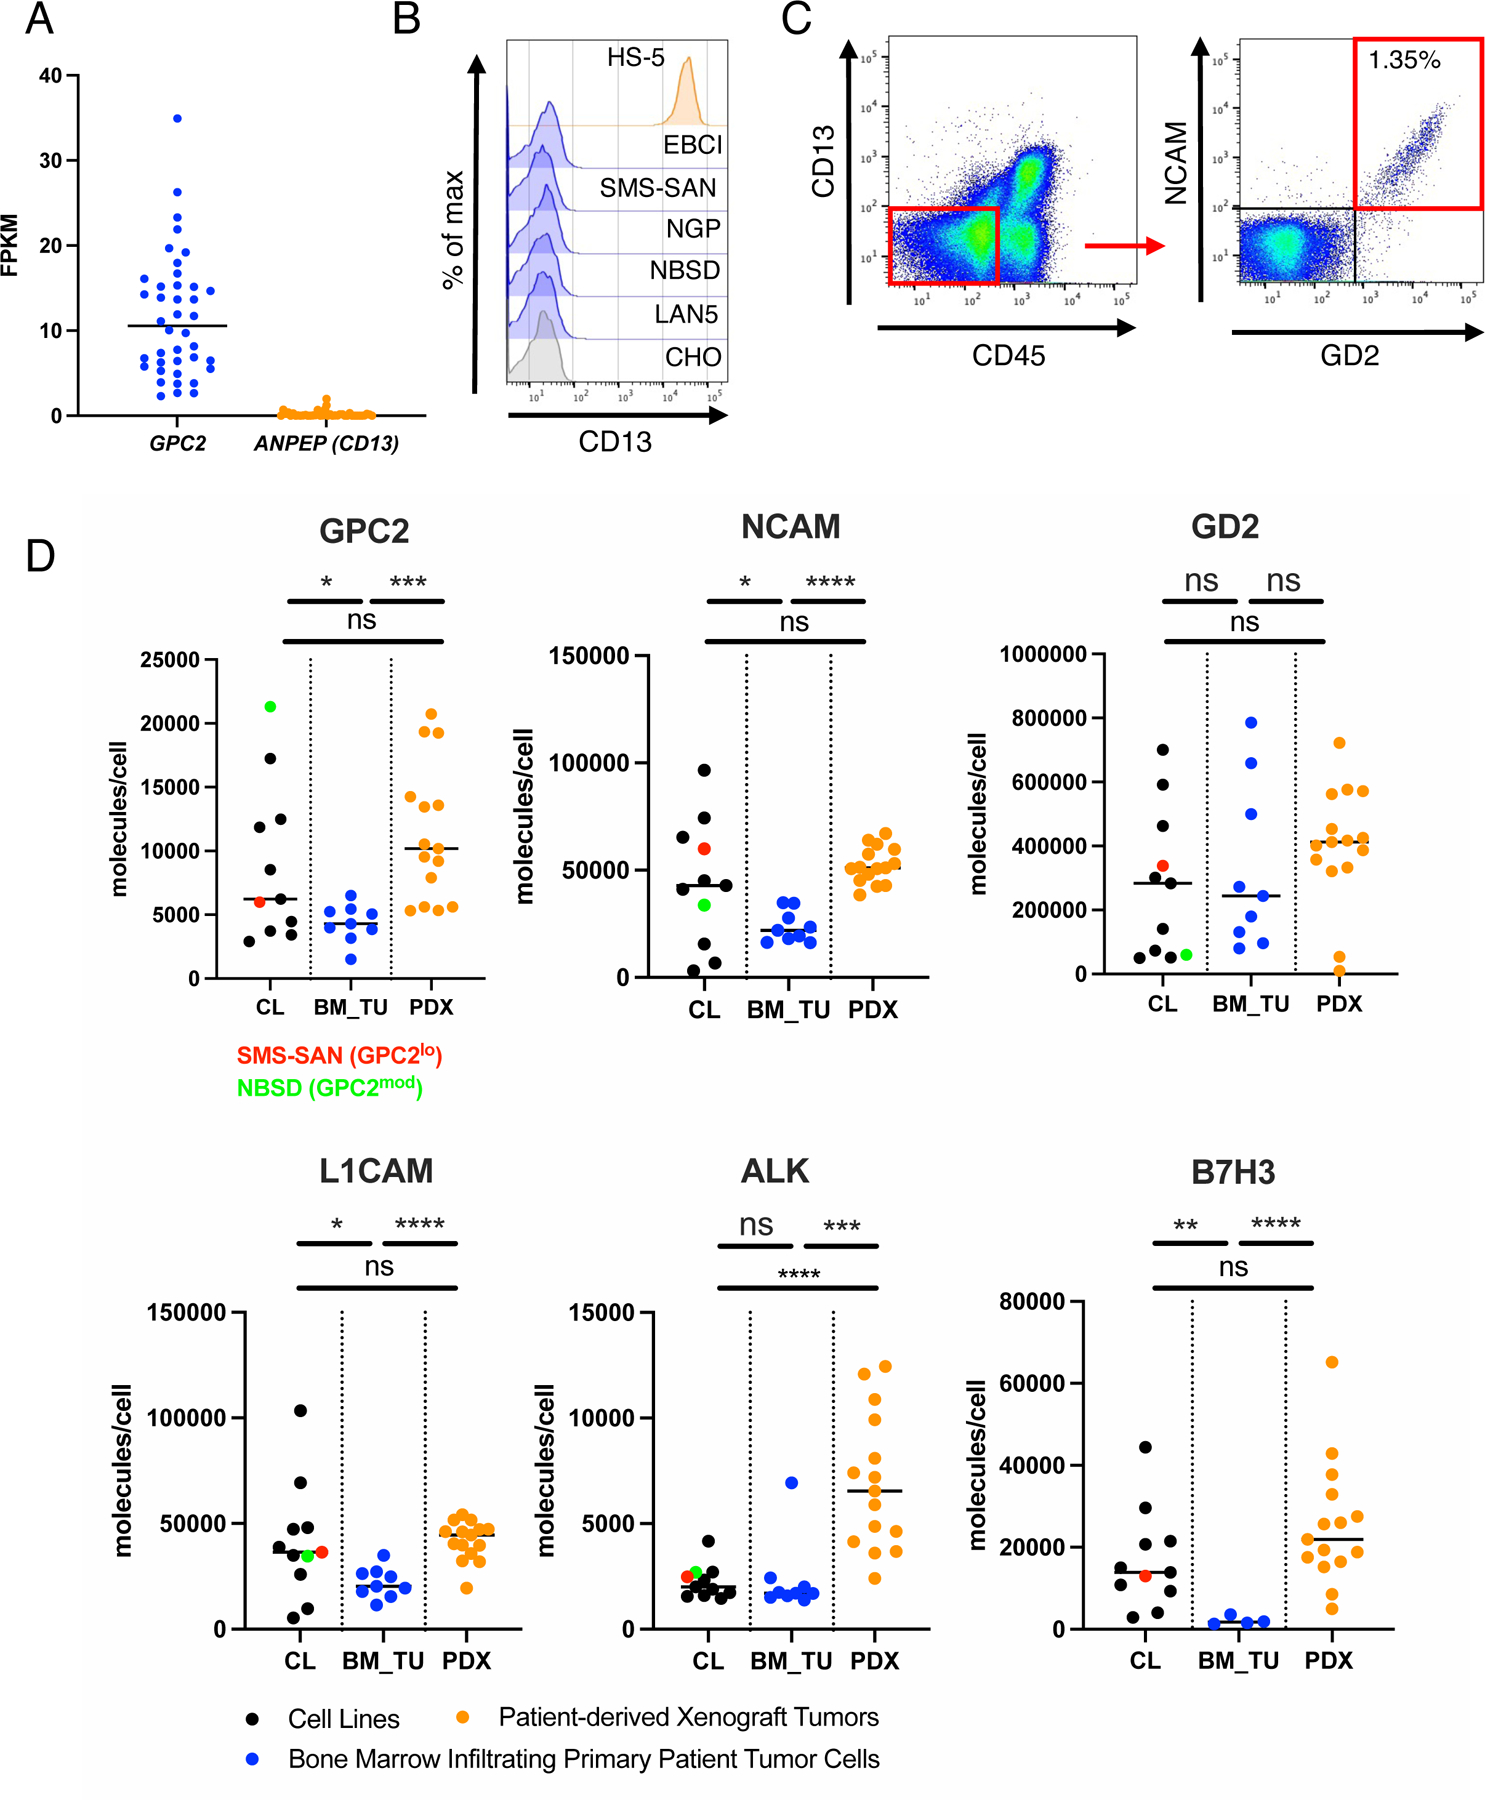
Figure 2. Antigen density of candidate immunotherapy targets on clinical samples of NB cells metastatic to the bone marrow.

A) Gene expression of GPC2 and ANPEP (CD13) in a panel of NB cell lines (dataset: GSE89413)
B) Flow cytometric cell surface expression of CD13 on negative CTRL cells (CHO), NB cell lines and HS-5 BM stroma cells.
C) Representative CD45-CD13- and NCAM+GD2+ gating strategy to identify NB tumor cell populations in clinical BM samples.
D) Cell surface antigen quantification (molecules/cell) of GPC2, NCAM, GD2, L1CAM, ALK and B7-H3 on BM infiltrating NB cells (BM_TU), Cell Lines (CL) and patient derived xenograft tumors (PDX) assessed by multicolor flow cytometry antigen density quantification assay. Horizontal lines indicate median. Statistics represent Welch’s t-test (**** = p<0.0001, *** = p<0.001, ** = p<0.01, * = p<0.05), ns = p > 0.05). Statistical parameters of the samples are shown in Figure S3B.
See also Figure S3.
