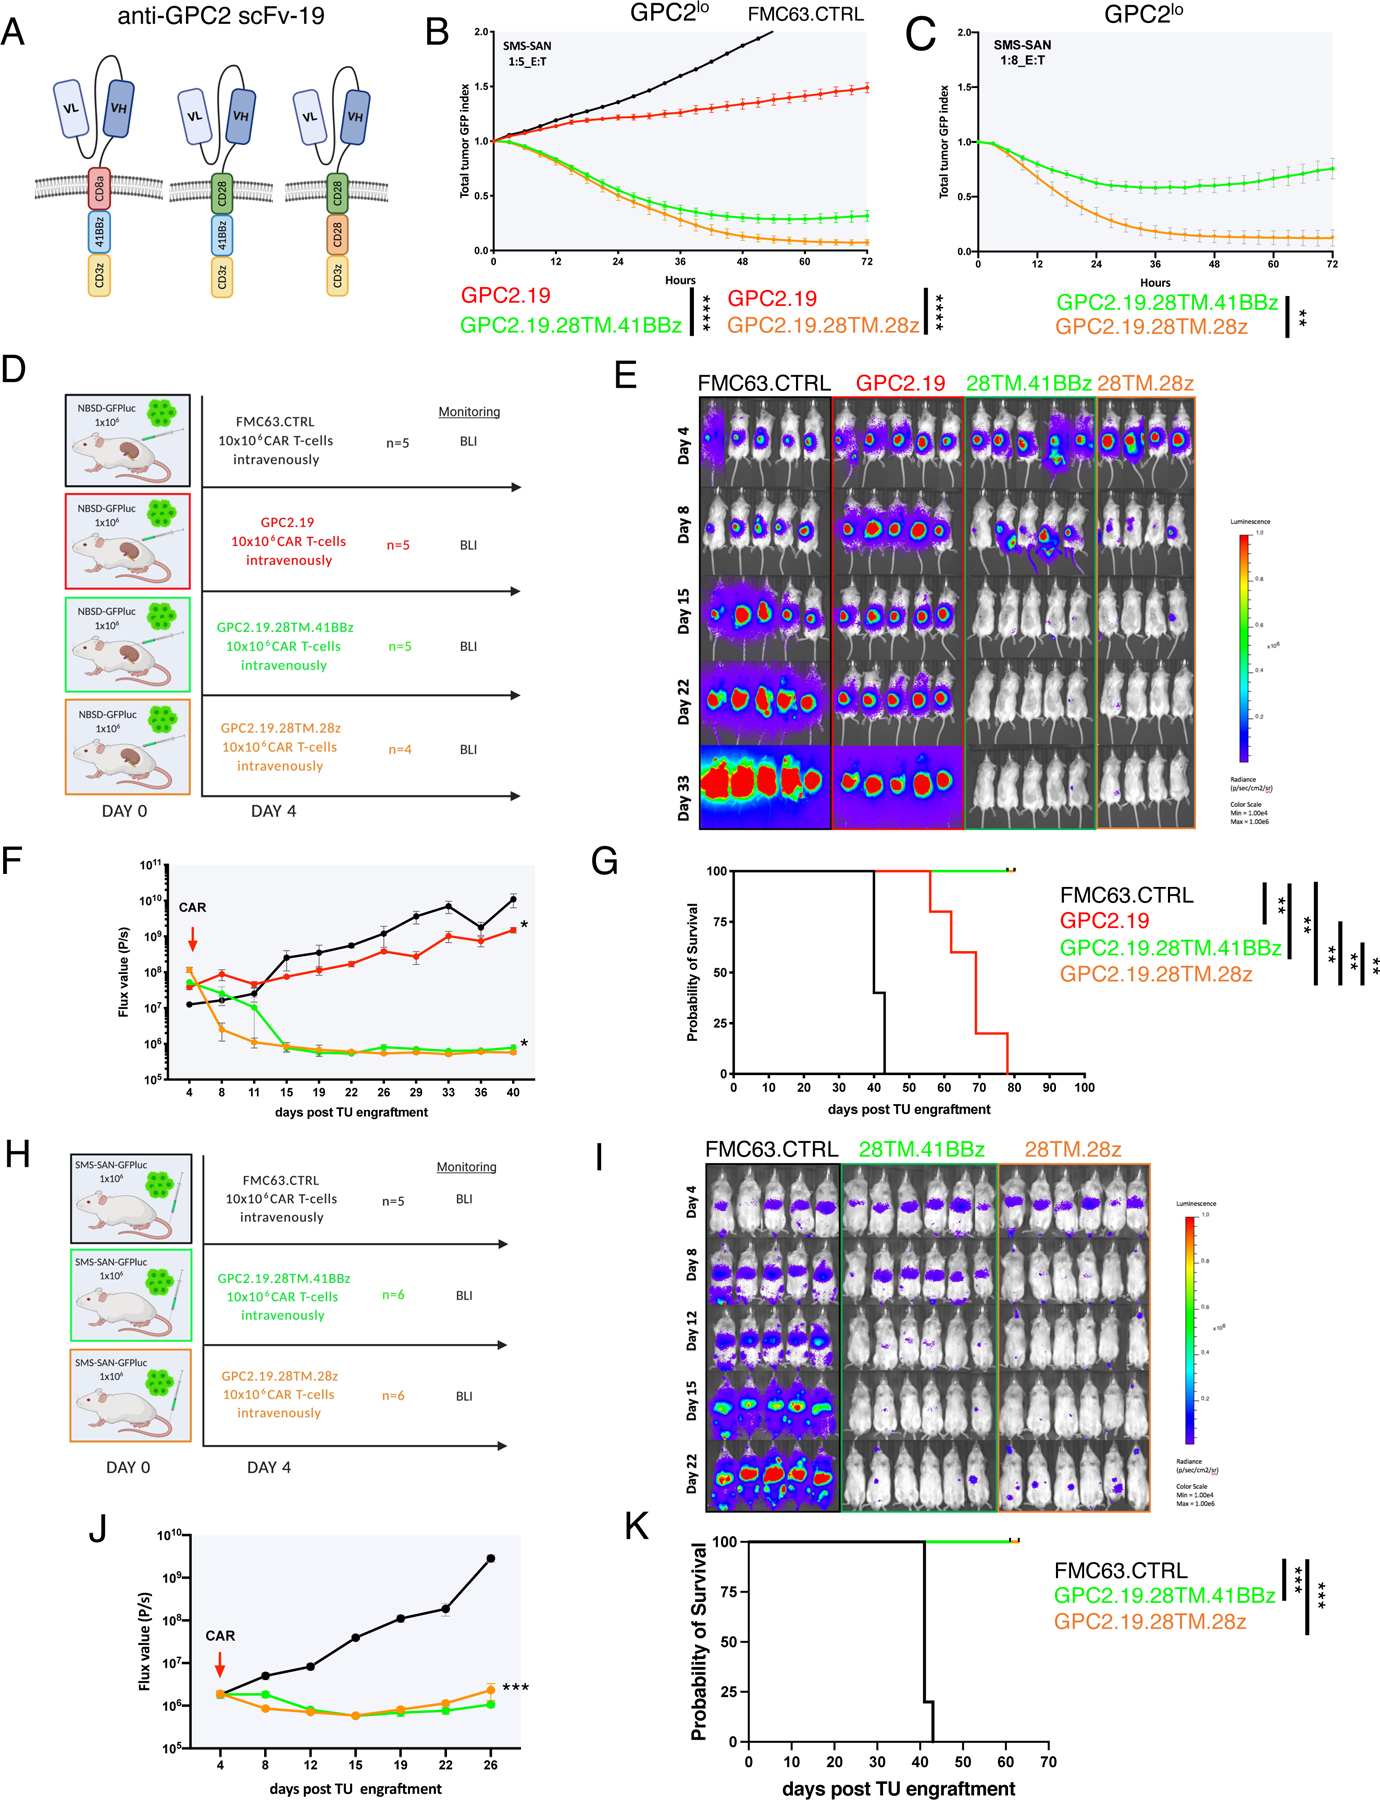
Figure 3. GPC2-CAR T cells incorporating a CD28 TM eradicate GPC2mod and GPC2lo NBs.

A) Schematic of GPC2.19.8TM.41BBz (left), GPC2.19.28TM.41BBz (center) and GPC2.19.28TM.28z (right) CAR constructs.
B-C) Cytolytic activity of these CAR T cells against SMS-SAN (GPC2lo) at B) 1:5 and C) 1:8 effector:target ratio. Representative of n=3 independent experiments with n=3 individual donors.
D) Experimental in vivo setup testing GPC2.19-CAR T cell constructs shown in (A) in a para-orthotopic GPC2mod (NBSD) NB renal capsule model.
E-G) Bioluminescence images (E) (BLI) and F) FLUX [P/s] values of tumor burden assessed by IVIS imaging, and G) Kaplan-Meier survival analysis of treatment arms shown in (D). Statistical analysis for survival curves represents log-rank test. One mouse in the FMC63.CTRL group died during imaging on day 40 and was censored from the analysis. Representative of n=3 independent experiments with n=3 individual donors.
H) Experimental in vivo setup testing constructs shown (A) in GPC2lo (SMS-SAN) metastatic xenograft model.
I-K) BLI images (I) and J) FLUX [P/s] values of tumor burden assessed by IVIS imaging, and K) Kaplan-Meier survival analysis of treatment arms shown in H. Representative of n=1 experiment. Statistical analysis for survival curves represents log-rank test. Values in B, C, F, J represent mean ± SEM. Statistical test in B, C, F, J represents two-way RM-ANOVA (**** = p<0.0001, *** = p<0.001, ** = p<0.01, * = p<0.05), ns = p > 0.05).
