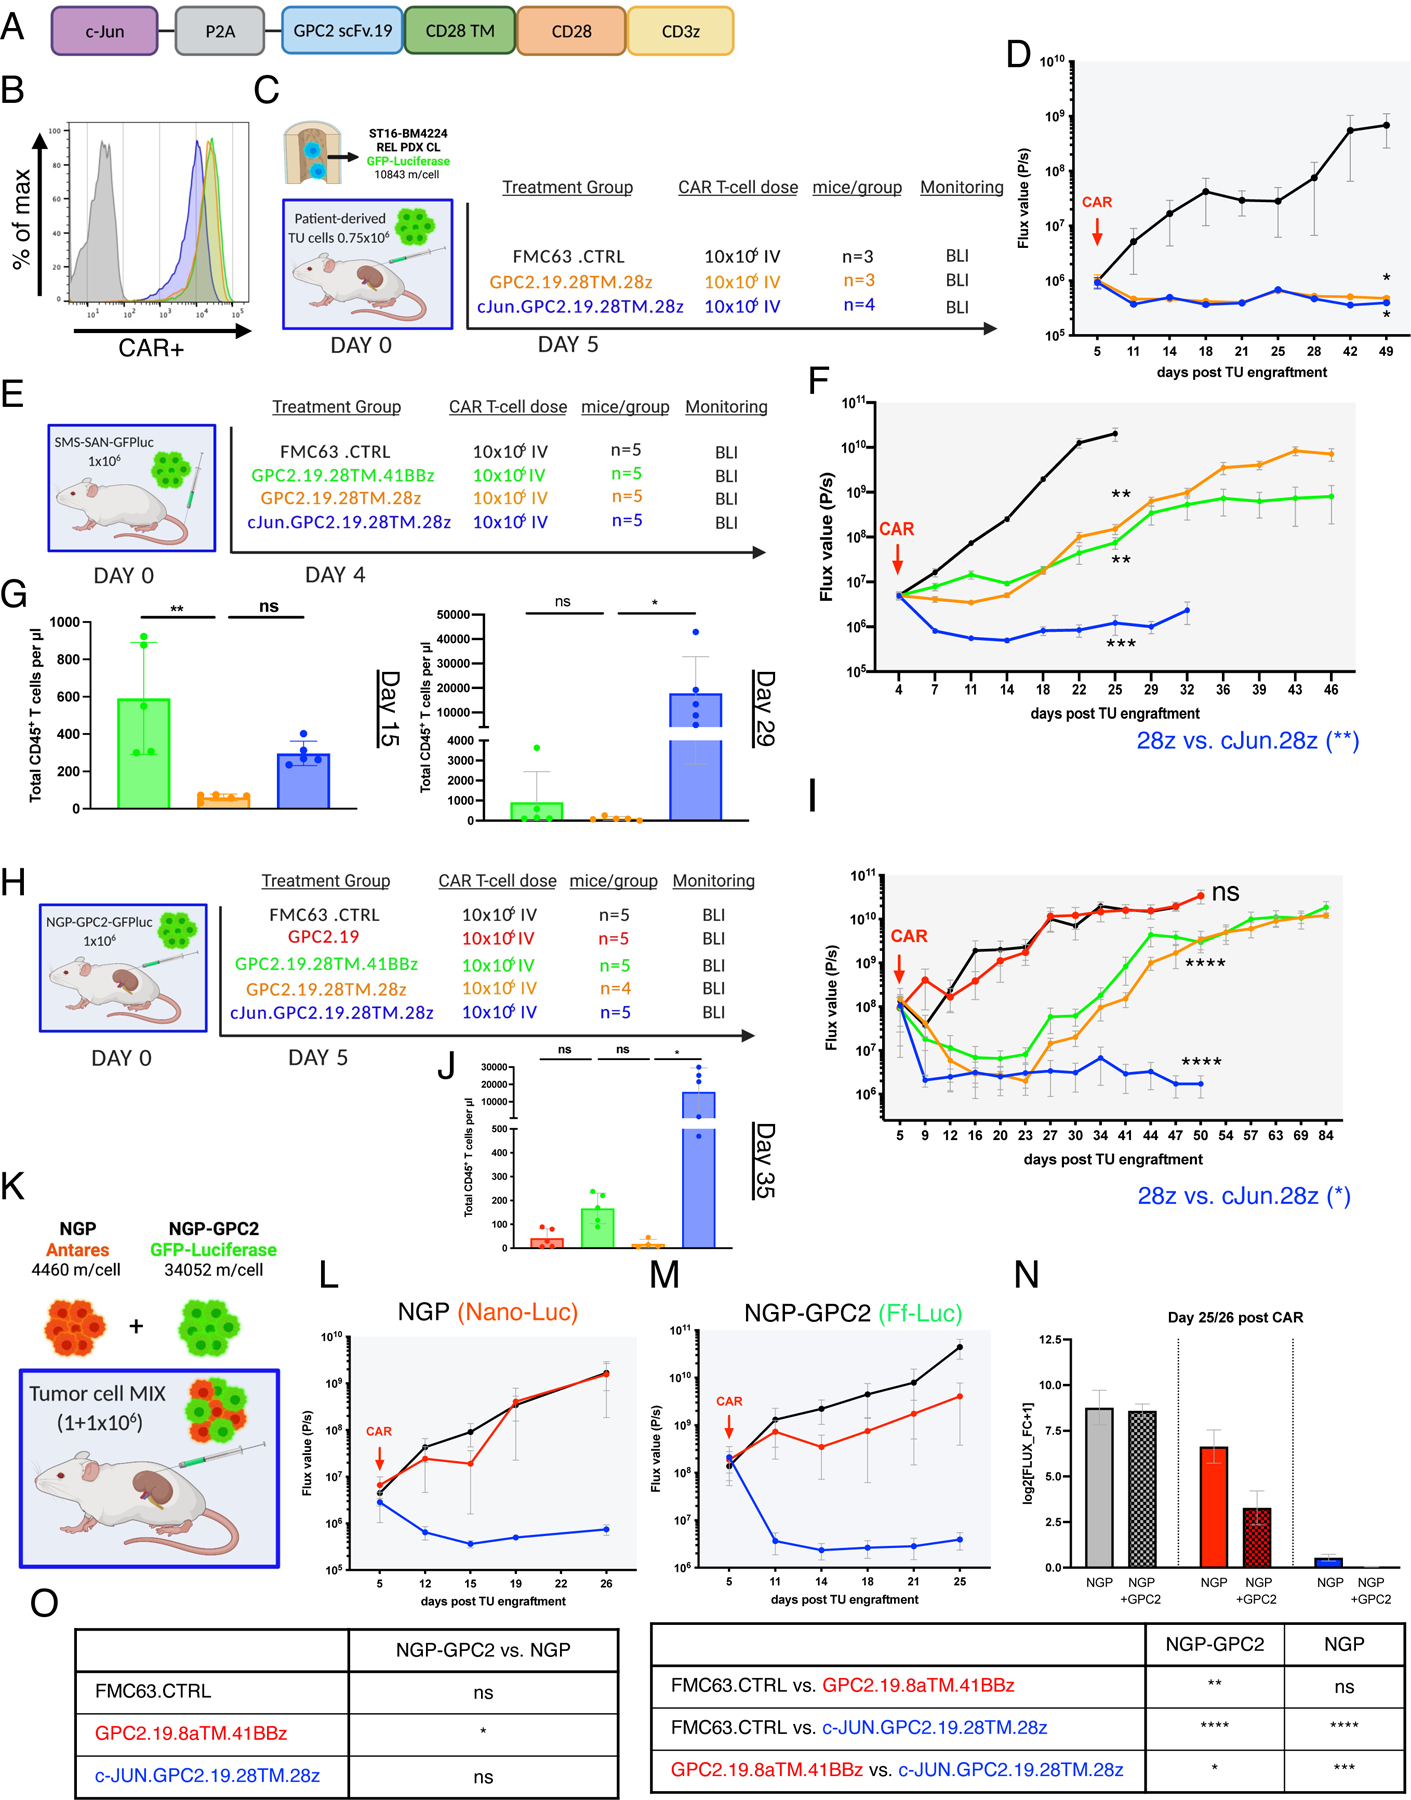
Figure 6. Overexpression of c-Jun enhances GPC2-CAR potency.

A) Schematic of the c-Jun.GPC2.19.28TM.28z expression vector.
B) Flow cytometry cell surface analysis of GPC2.19-CAR T cell constructs used in vivo as compared to Mock T cells. Color legend of B, D, F and G shown in E.
C) Experimental in vivo setup testing GPC2.19.28TM.28z CAR T cells +/− c-Jun in para-orthotopic renal capsule xenograft model of tumor cells isolated from the BM of patient ST16 at tumor relapse.
D) Corresponding FLUX [P/s] values of tumor burden assessed by IVIS imaging. Statistic represents one-tailed Mann Whitney test at experimental endpoint (d49).
E) Experimental in vivo setup testing c-Jun overexpressing GPC2.19-CAR T cell constructs in comparison to 28TM.41BBz and 28TM.28z in GPC2lo (SMS-SAN) metastatic xenograft model. Representative of n=1 experiment.
F) Corresponding FLUX [P/s] values of tumor burden assessed by IVIS imaging. Statistic represents 2-Way RM-ANOVA by day 25. Endpoint of c-Jun.GPC2.19.28TM.28z group was onset of GvHD on d32.
G) Persistence of CD45+ CAR T cells/µl blood on mice shown in (F) on d15 and d29. Statistic represents one-way multiple comparisons ANOVA.
H) Schematic of experimental setup testing c-Jun overexpressing GPC2.19-CAR T cell constructs in comparison to GPC2.19.28TM.41BBz and GPC2.19.28TM.28z in para-orthotopic NB renal capsule xenograft model engrafted with NGP-GPC2 (GPC2hi) cells. Representative of n=1 experiment.
I) Corresponding FLUX [P/s] values of tumor burden assessed by IVIS imaging. Endpoint of c-Jun.28TM.28z group was onset of GvHD on day 50. Statistic represents 2-Way RM-ANOVA by day 50.
J) Persistence of CD45+ CAR T cells/µl blood on day 35. Statistic represents one-way multiple comparisons ANOVA.
K) Experimental in vivo setup for dual-imaging in para-orthotopic NB renal capsule xenograft model engrafted with GPC2lo/GPC2hi-MIX.
L-M) Corresponding FLUX [P/s] values of NGP tumor burden assessed by IVIS imaging using (L) Nano-Luciferase substrate and M) NGP-GPC2 tumor burden using Firefly-Luciferase substrate post treatment with 10×106 FMC63.CTRL (n=3), GPC2.19.8TM.41BBz (n=3) or c-Jun.GPC2.19.28TM.28z (n=3) CAR T cells N) Tumor burden of GPC2lo and GPC2hi normalized to pre-treatment. Data represents log2 transformed FLUX fold-change+1 at the endpoint (day 26 for NGP, day 25 for NGP-GPC2). Values in D, F, I, L, M, N represent mean ± SEM. Values in G, J represent mean ± SD.
O) Statistical analysis of data shown in N), representing one-way multiple comparison ANOVA (**** = p<0.0001, *** = p<0.001, ** = p<0.01, * = p<0.05), ns = p > 0.05).
See also Figure S5.
