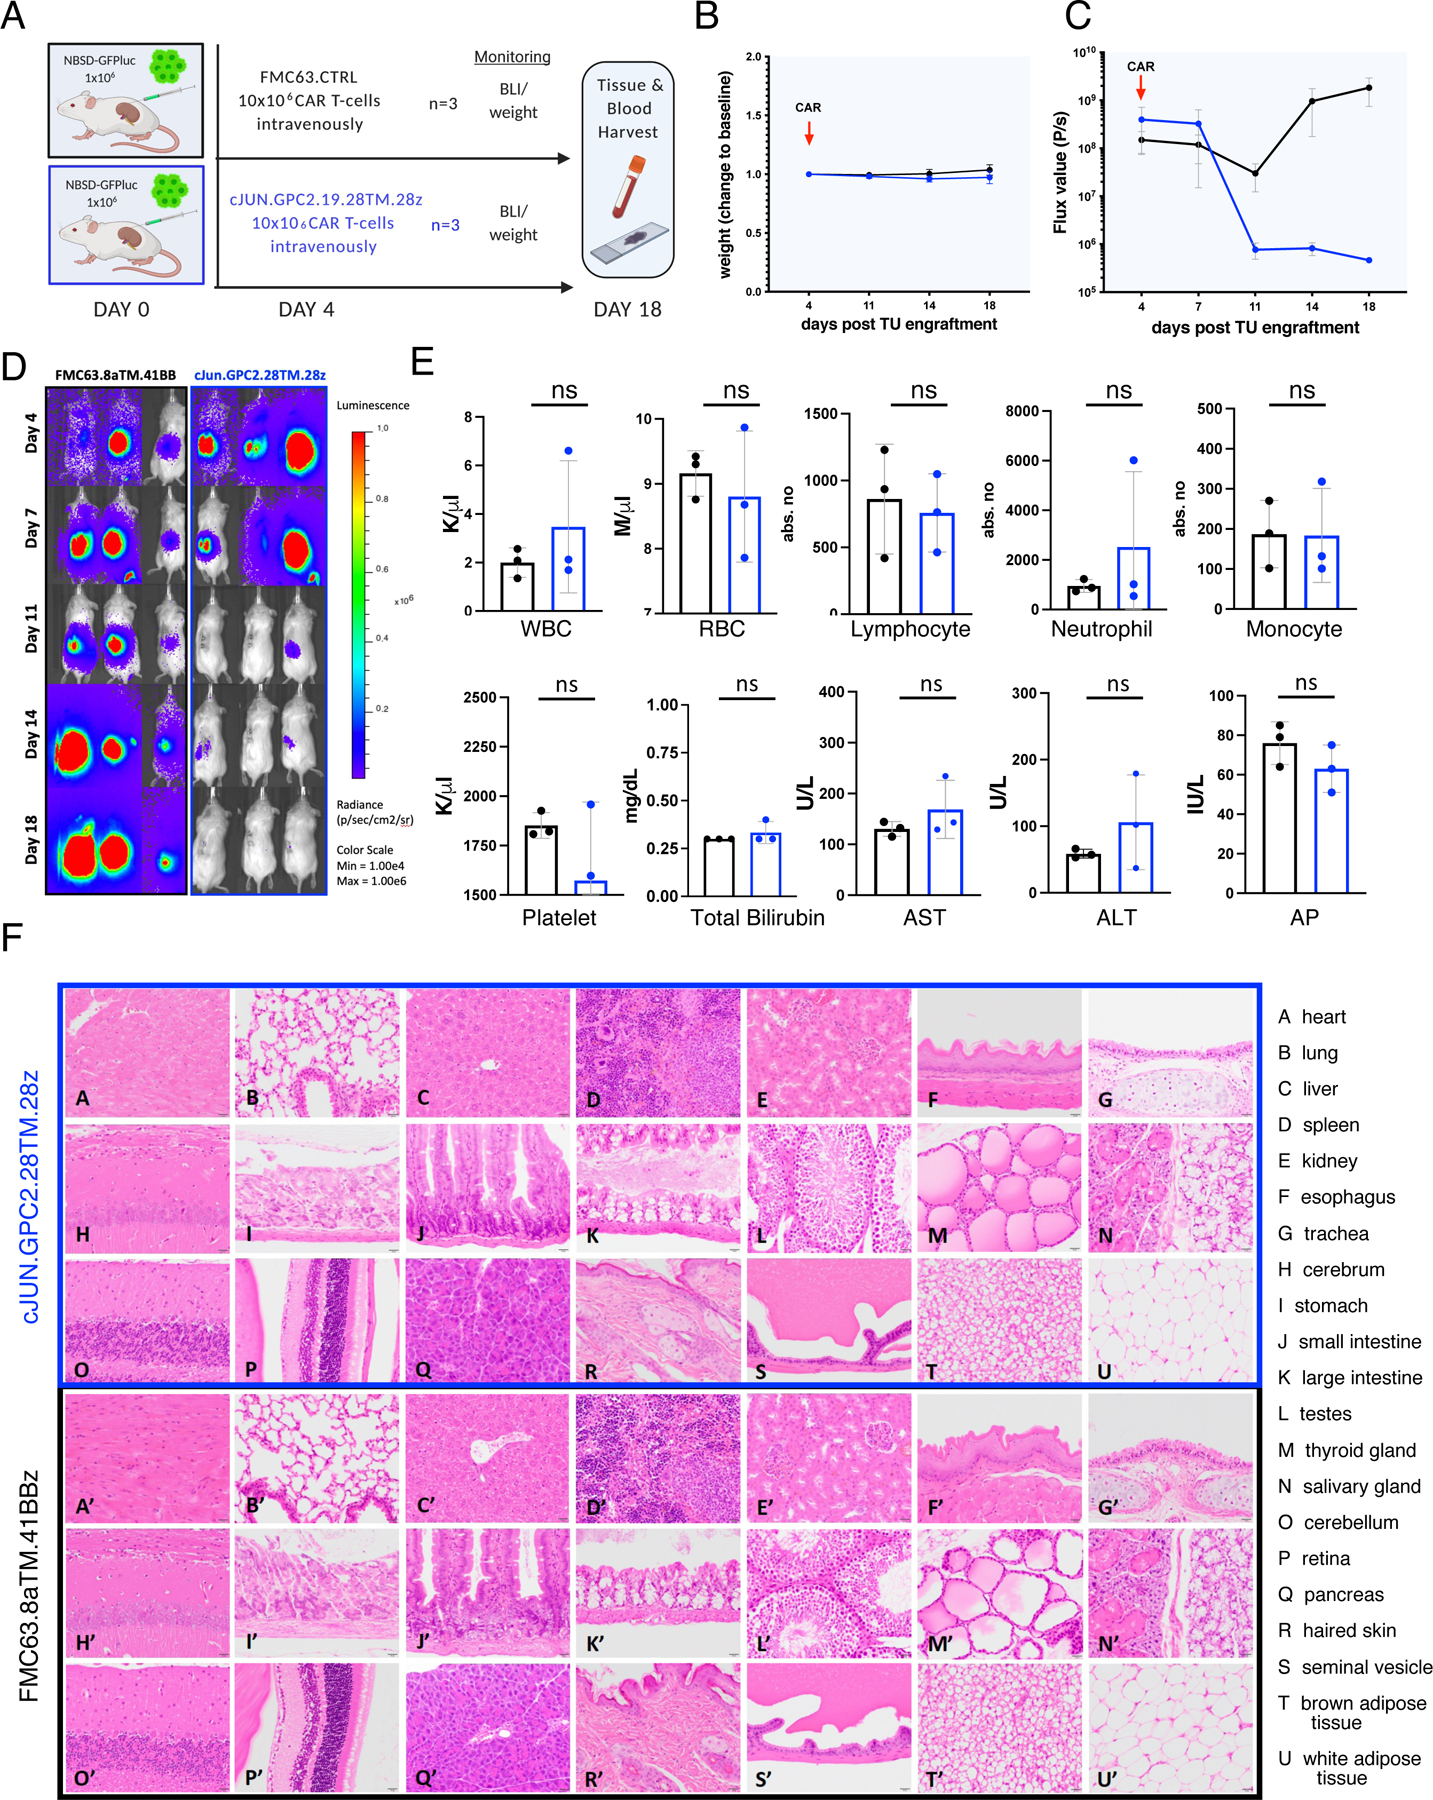
Figure 8. c-Jun overexpressing GPC2-CAR T cells eradicate tumor in the absence of toxicity.

A) Schematic of experimental setup (n=1): NSG mice were engrafted with 1×10⁶ NBSD tumor cells beneath the left renal capsule and treated with 10×106 c-Jun.GPC2.19.28TM.28z or control FMC63 CAR T cells on d4 via IV tail vein injection. Tumor burden and weight was followed until the endpoint on day 18.
B) Weight of treated mice as change to baseline over the course of the experiment. Values represent mean ± SD.
C) FLUX [P/s] values of tumor burden assessed by IVIS imaging and D) BLI images. Values in C) represent mean ± SEM.
E) Assessment of blood cell populations and liver function parameters (transaminases AST, ALT and alkaline phosphatase). Values represent mean ± SD. Statistic represents Student’s t-test (**** = p<0.0001, *** = p<0.001, ** = p<0.01, * = p<0.05), ns = p > 0.05).
F) Hematoxylin and eosin [H&E] stained tissues from mice either treated with GPC2.19 28TM.28z CAR T cells (A-U) or FMC63 control CAR T cells (A’-U’). Magnification: 40x. Scale bar: 20μm.
See also Figures S7-8.
