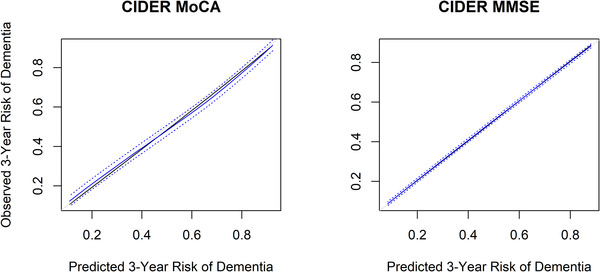
FIGURE 1.

Calibration plots from internal validation (bootstrapping corrected overfitting)—model developed based on NACC. Black: Observed line shows the relationship between the (not overfitting corrected) predicted 3‐year dementia risk and the actual dementia risk. Gray: Ideal line for predicted versus observed risks. Blue: Relationship between the overfitting corrected predicted 3‐year dementia risk and the actual dementia risk, based on bootstrapping (B = 500) and subsetting predictions into intervals by interpolation (containing 50 individuals on average). The blue dotted line above and below the blue line shows the 95% confidence interval based on the mean prediction error. CIDER, Mild Cognitive Impairment to Dementia Risk; MMSE, Mini‐Mental State Examination; MoCA, Montreal Cognitive Assessment; NACC, National Alzheimer's Coordinating Center
