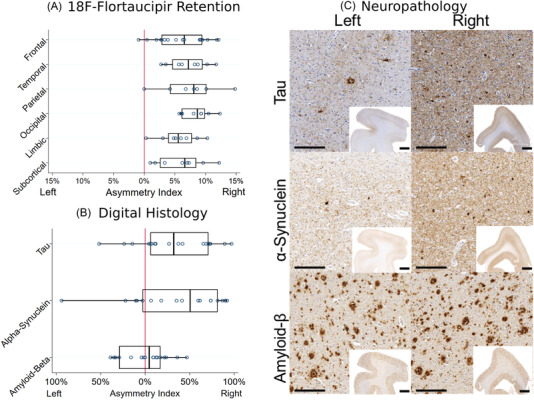
FIGURE 1.

A, Asymmetry indices calculated from regional 18F‐flortaucipir positron emission tomography (PET) image standardized uptake value ratio. B, Asymmetry indices calculated from digital histological measurements of % area occupied by pathological inclusions of tau, α‐synuclein, and amyloid beta (Aβ). Right lateralization was observed for all PET region groups and for tau and α‐synuclein pathology while Aβ pathology was symmetric. C, Representative images from the bilateral sections of the dorsolateral prefrontal cortex immunostained for tau, alpha synuclein, and Aβ. High‐magnification images were taken at 10x with scale bar of 200 μm. Low‐magnification inset images were taken at 0.5x with a scale bar of 2 mm. Higher density tau and αsynuclein pathology is noted in the right hemispheric sections whereas Aβ pathology is equally distributed
