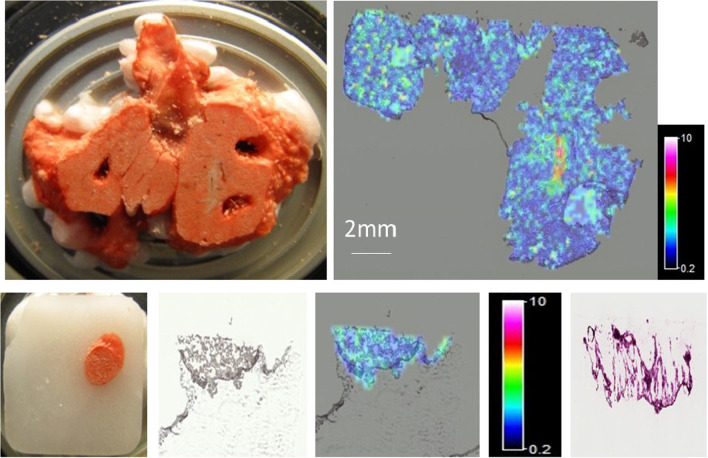
Fig. 1.
Pre-Clinical Study in rats—MALDI-MS imaging of a 16 µm thick tissue section of rat lung and a 5 mm punched biopsy of rat lung, taken 65 min after a nebulised administration of ipratropium. Top Left—Photo of the region of the tissue from where the section had been cut (after removal of multiple punched biopsies). Top Right—MALDI-MS Image showing the distribution of the m/z 166 fragment ion, representative of ipratropium in Rat 7, section 13 (200 µm spatial resolution). The signal intensity for the ipratropium fragment ion at m/z 166.0 is represented as a concentration-dependent colour scale—white being highest concentrations. Bottom Left to Right: a Photo of 5 mm punched biopsy from rat lung. b Optical Image (digitally scanned image of rat lung section). c MALDI-MS image, 200 µm spatial resolution (and Signal Intensity Scale bar). d Histology image (Consecutive section)

